Basic Concepts
Transactions
Section titled “Transactions”In jvmguard, a transaction is a method invocation whose timing you want to measure. jvmguard records the timing of the invocation and constructs a transaction name that identifies it.
The transaction naming has a significant impact on what you will see in the jvmguard UI.
- It enables you to understand what triggered the transaction.
- It groups all invocations with the same transaction name and so determines the granularity at which they are measured.
- It can serve as a basis to filter out unwanted operations.
jvmguard cannot know which method invocations are relevant to you, so configuring transactions is an important part in setting up an application for monitoring. You define transactions by selecting the methods of interest, either directly in the jvmguard UI or with annotations in your code.
For example, you might want to measure the invocations of a service method. By default, the transaction name is the class and method name, but you can compose it from naming elements such as the value of a method parameter or the result of a getter call on the instance. This lets you group invocations by the data that matters for your analysis.
If some of the intercepted invocations are not interesting, you can discard transactions based on the name that would be associated with them. If you generate too many different transaction names, jvmguard caps the number of distinct names and sends you an inbox message with instructions on how to fix this condition.
From the recorded transactions, jvmguard builds a call tree and hot spots that show you where the time is actually spent.
Policies
Section titled “Policies”Transactions have associated policies. The policies determine
- the acceptable timing for a transaction
- the way errors are detected and handled
For each violated condition in the policies, you can see transaction details separately in the jvmguard UI. For example, you can inspect slow transactions or transactions that resulted in an error separately and not cumulated with other regular transactions of the same name.
jvmguard gets information from the monitored application by instrumenting methods. To keep the overhead low, only the methods that are part of your transaction definitions are instrumented. When a policy violation needs deeper analysis, you can configure a trigger to take a profiling capture for the offending VM.
Telemetries
Section titled “Telemetries”The other fundamental type of data source in jvmguard is the periodic sampling of scalar values, like heap size or thread count. Each telemetry can be plotted as a time-resolved graph. In jvmguard, telemetries are often shown as sparklines, without defined axes and with a trailing current value.
There are many standard telemetries in jvmguard that collect their data from well-known subsystems of the JVM. In
addition, integer values that are exposed by an
MBean can be monitored by jvmguard. On a programmatic level, you
can use the @Telemetry annotation to define custom telemetries on
static methods with a numeric return value.
Thresholds
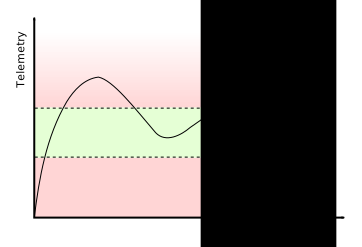
Section titled “Thresholds”There can be different expectations with respect to different telemetries. For example, the heap usage often oscillates around a baseline and where a steady increase is a sign of a bug in the application.
Or, the number of live threads should stay below a limit that you derive from the capacity of the machine.
To detect anomalous conditions, you define thresholds with an optional lower and an optional upper bound. Threshold violations are counted on a per-VM basis or for each VM group. They do not have actions associated with them. Sometimes, you may not want to take any action for single threshold violations, but only for a cascade of such conditions.
Triggers
Section titled “Triggers”Both transactions and telemetries can lead to anomalous conditions: A transaction policy can identify a slow transaction, and a telemetry threshold can be violated.
In order to take action on these conditions, you use triggers. Triggers do not operate on a per-VM level, they process all recursively contained VMs in a VM group. Each VM group in a hierarchy of groups has its separate triggers.
For example, you could define a trigger for all VMs that fires when the number of connected VMs falls below 20. In the same VM hierarchy, you might have a group that only contains database VMs. In that group, you might want a separate trigger that fires when the number of connected database VMs falls below 3.
When a trigger fires, it executes a list of actions. An action can take a profiling capture, such as a JFR recording, a heap dump or a thread dump, or it can send a notification by email, webhook, inbox message or an entry in the event log.