Telemetries
jvmguard observes scalar values from four different types of sources:
- Counts of entities that are managed by the jvmguard collector, like the number of connected VMs or the number of transactions. This is not a direct measurement in the monitored VM, but an evaluation in the jvmguard server.
- Telemetries that are measured inside the monitored VM, like the heap size, the CPU usage or the number of live threads.
- MBean telemetries that were configured in the recording settings.
- Declared telemetries where you have used the telemetry annotation from the jvmguard API.
Telemetry data view
Section titled “Telemetry data view”All telemetries are available in the “Telemetries” view. Each standard telemetry, MBean telemetry and Declared telemetry has its own entry under the “Telemetries” node.
Many telemetries are stacked area plots where the single lines add up to a total value. For example, the “Transactions” telemetry shows the total number of transactions over time, split into single lines for the various policy violations.
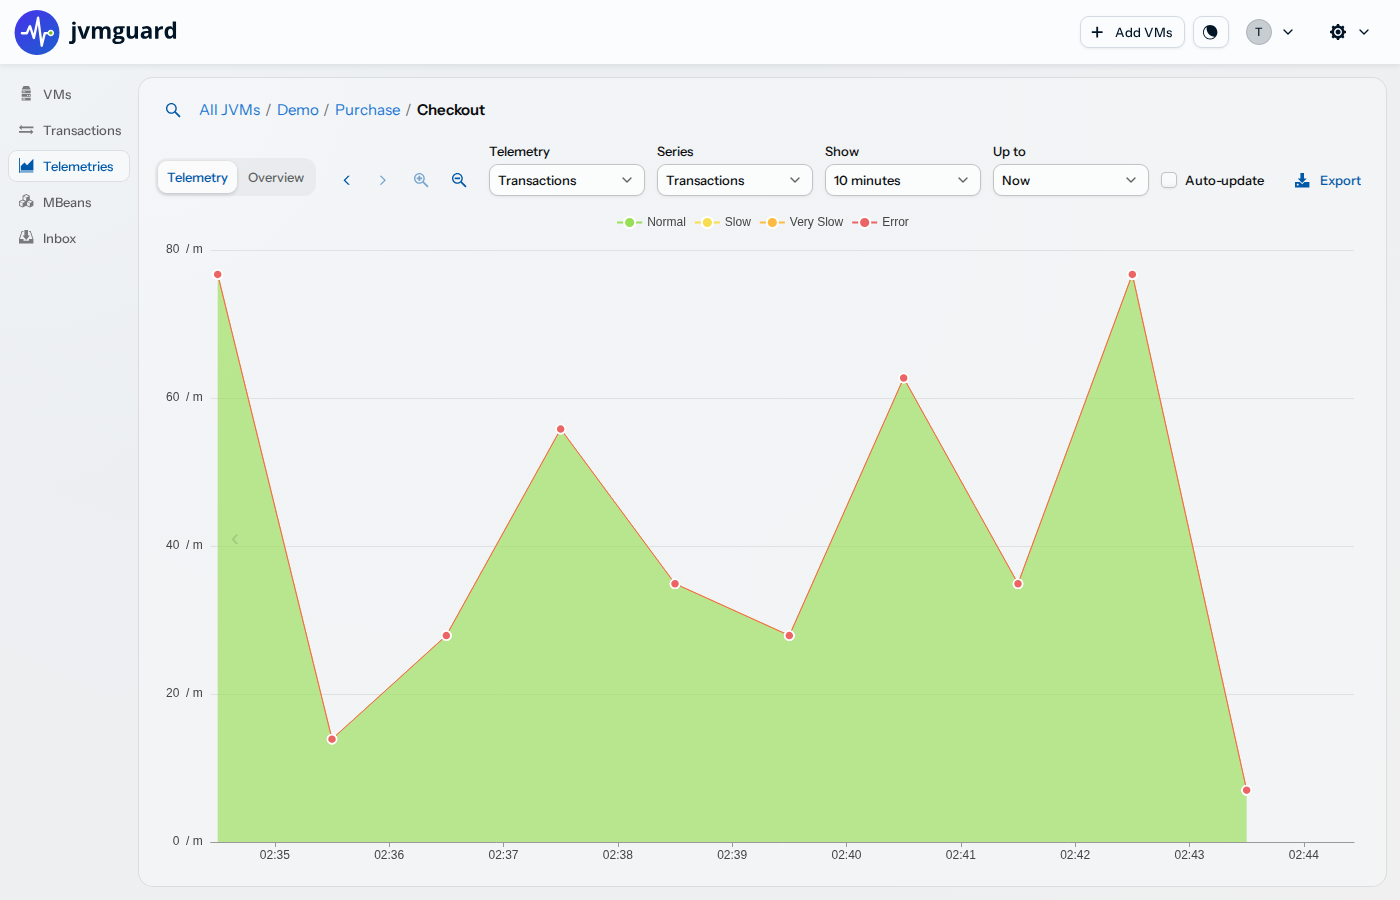
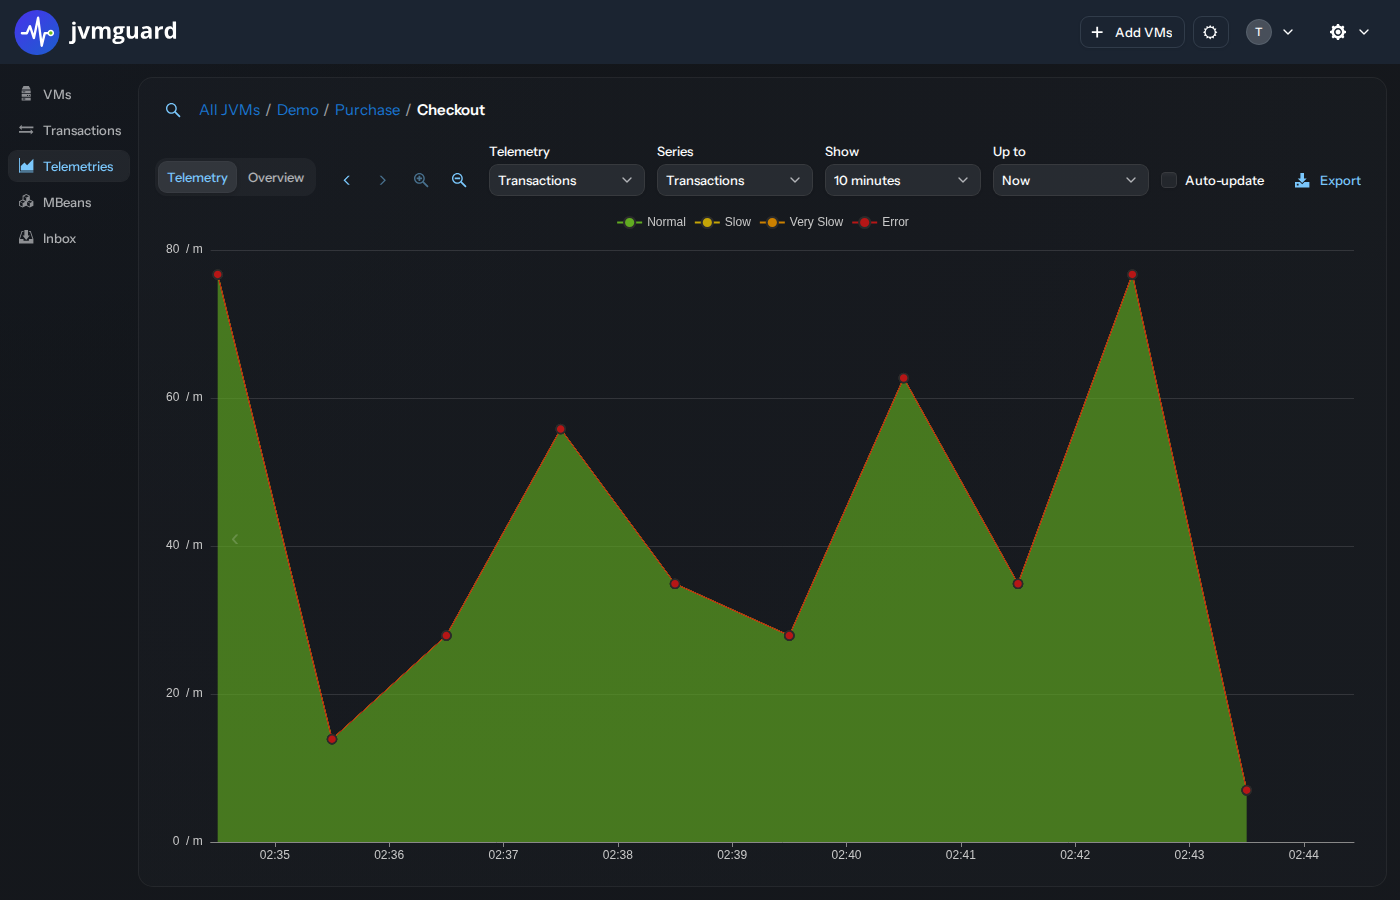
When you activate a telemetry view directly, a 10-minute interval up to the current time is shown. The data displayed here has been recorded with a resolution of one minute. Other telemetries that do not get its data from the observation of transactions will have a resolution of 10 seconds. You can move back in time with the navigation buttons at the top of the telemetry or the hover buttons at the edges of the telemetry itself, but at some point the one-per-minute resolution will end. jvmguard consolidates telemetries to progressively more coarse-grained resolutions and keeps them for progressively longer periods of time. Zooming out to an interval with a total extent of at least 3 hours, consolidated data points with a resolution of 2 minutes and a longer historical record are shown. Now you can move back further in time as compared to the previous higher resolution.
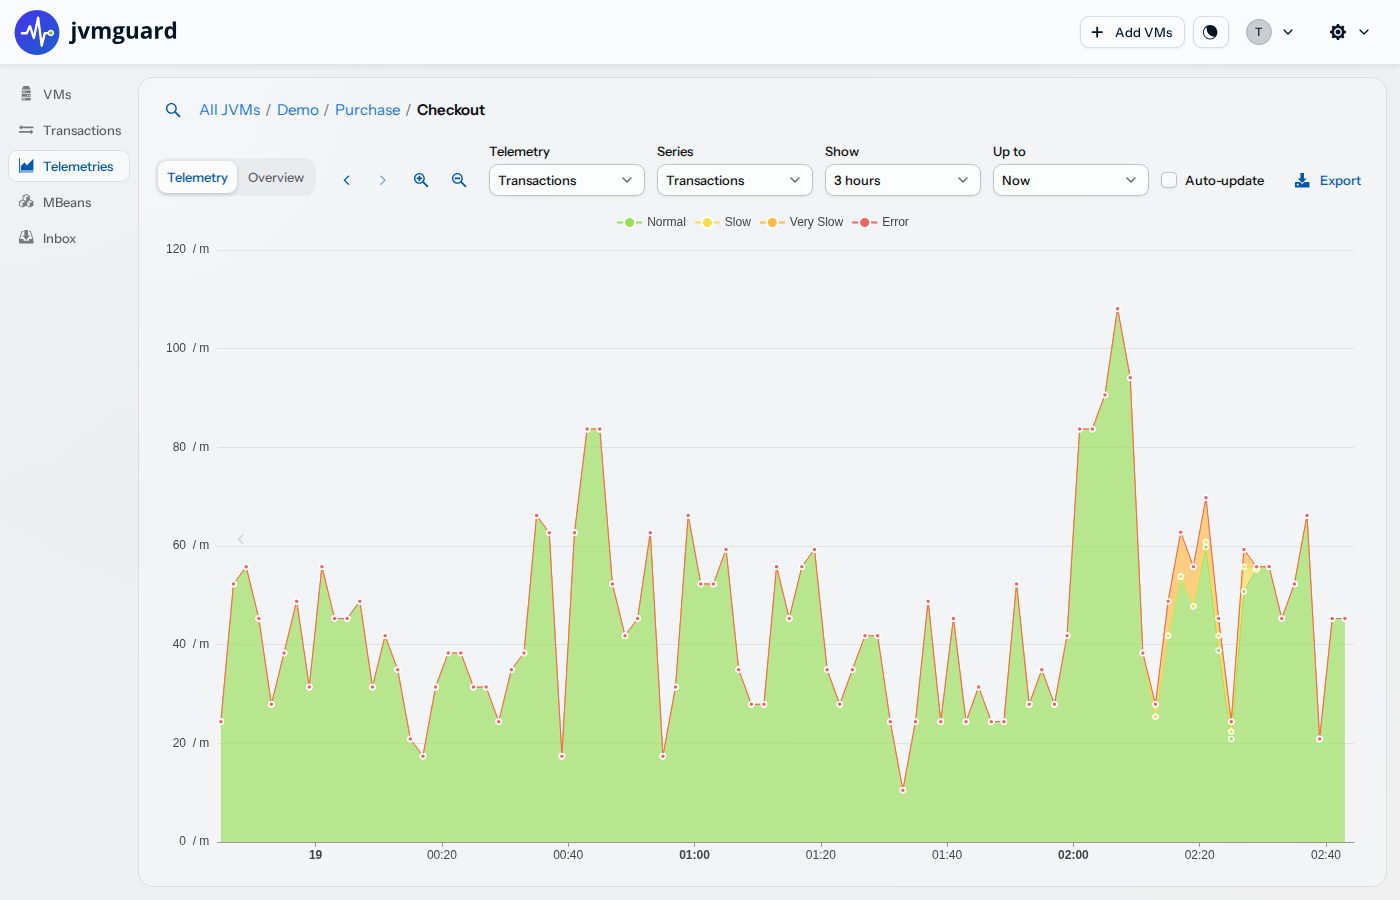
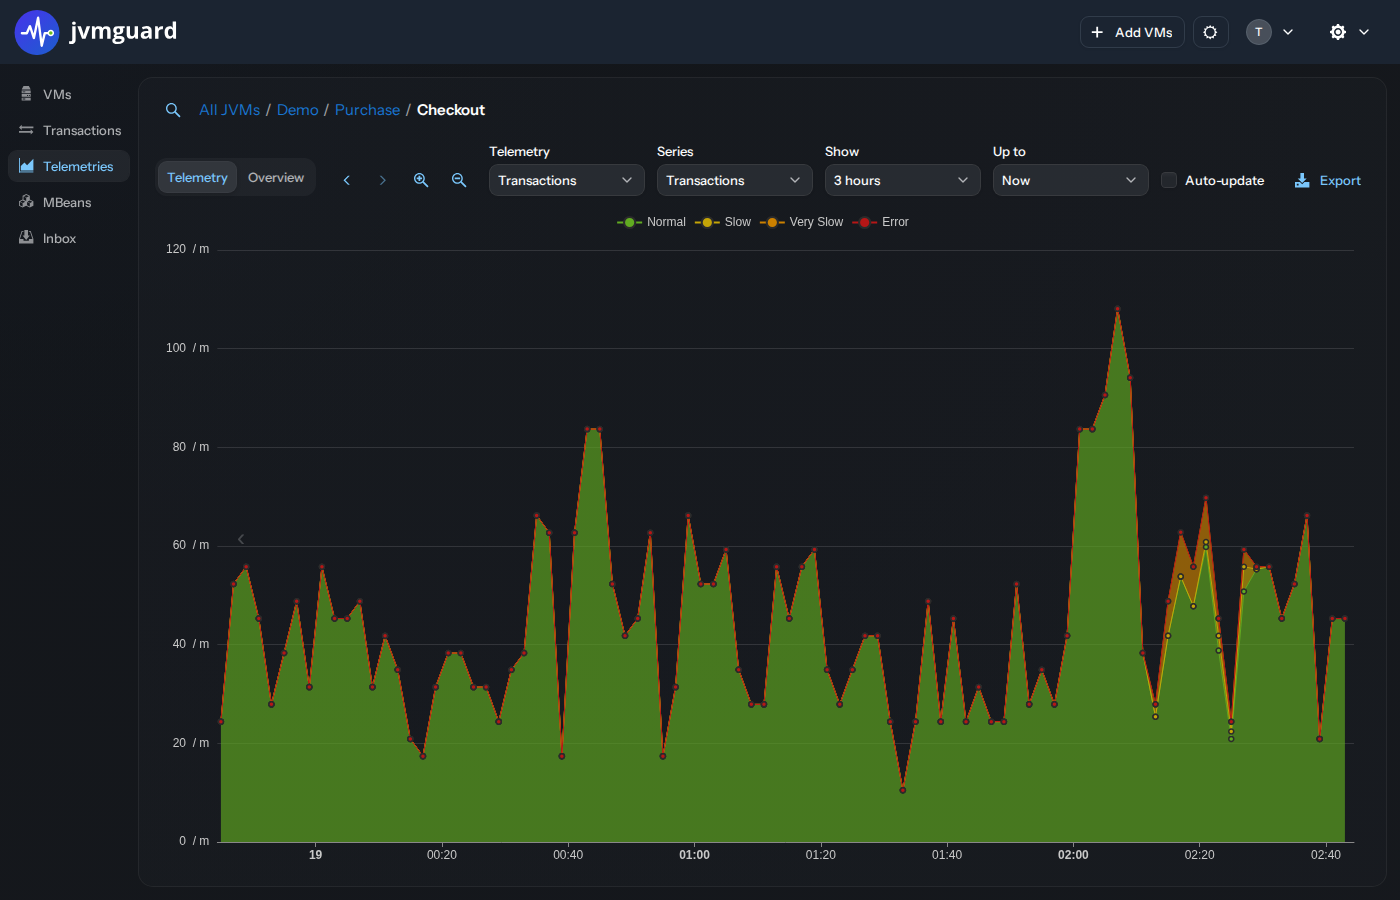
The full table with all display intervals where resolutions and retention times change is given below:
| Display interval | Resolution | Retention time |
|---|---|---|
| 10 minutes | 10 seconds (1 minute for transaction-based data) | 6 hours (48 hours for transaction-based data) |
| 3 hours | 2 minutes | 10 days |
| 3 days | 1 hour | 1 year |
| 30 days | 12 hours | unlimited |
Moving to earlier or later times shifts the starting point of the displayed interval by the total display range.
In between those display intervals, there are many other intervals that just increase the displayed time extent, but use the same resolution. With the zoom buttons at the top or in the context menu of the telemetry, you can change the zoom level to view more or less data. Double-clicking on the telemetry zooms in at the selected point in time, if possible.
Some telemetries have multiple data lines that do not add up to a total value. In that case, there is a drop-down box above the graph and the telemetries are shown as line plots.
As another example, the heap telemetry shows the used heap memory over time.
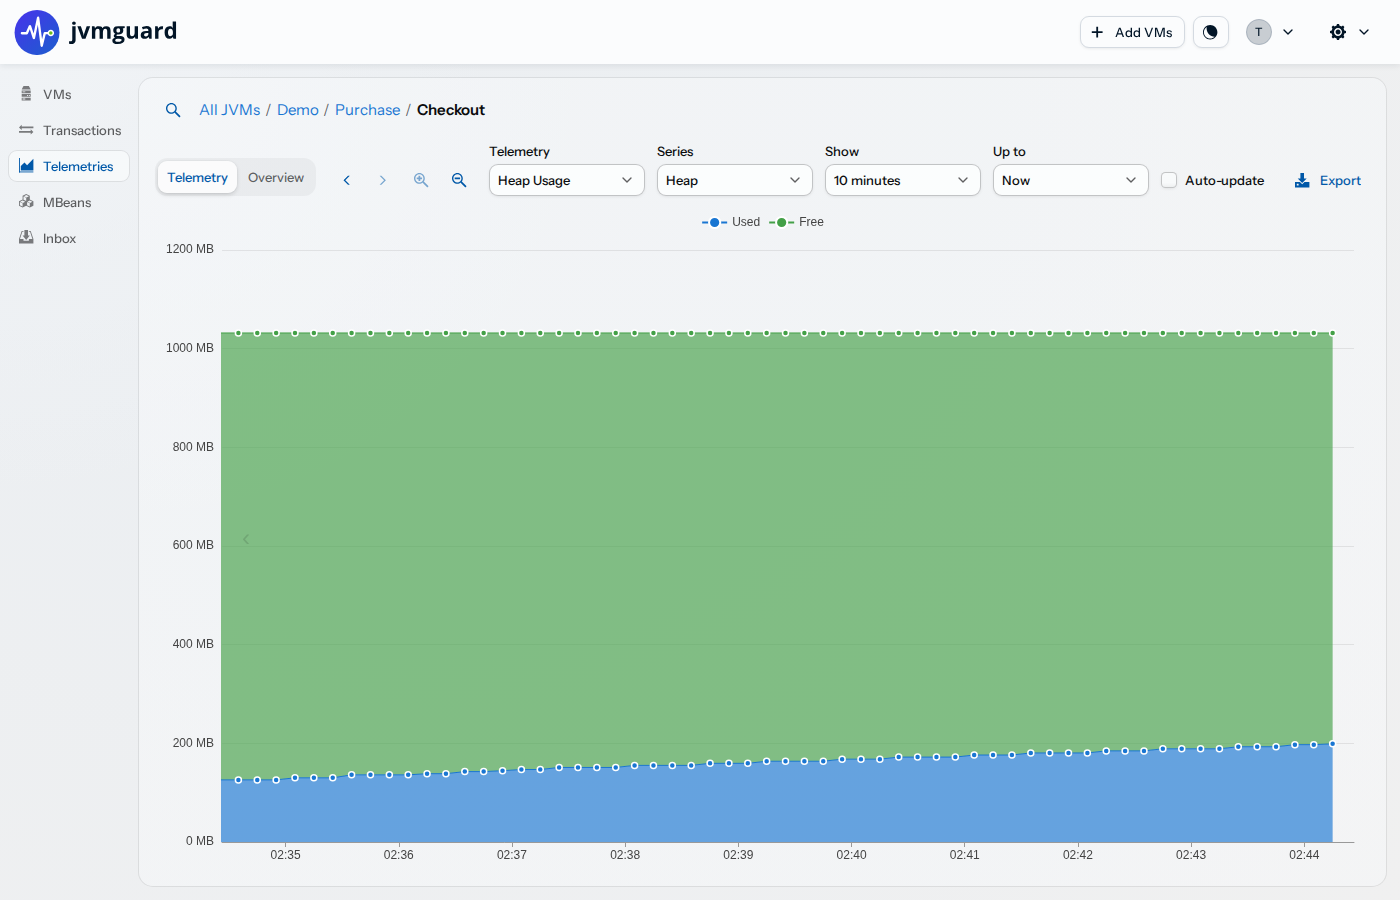
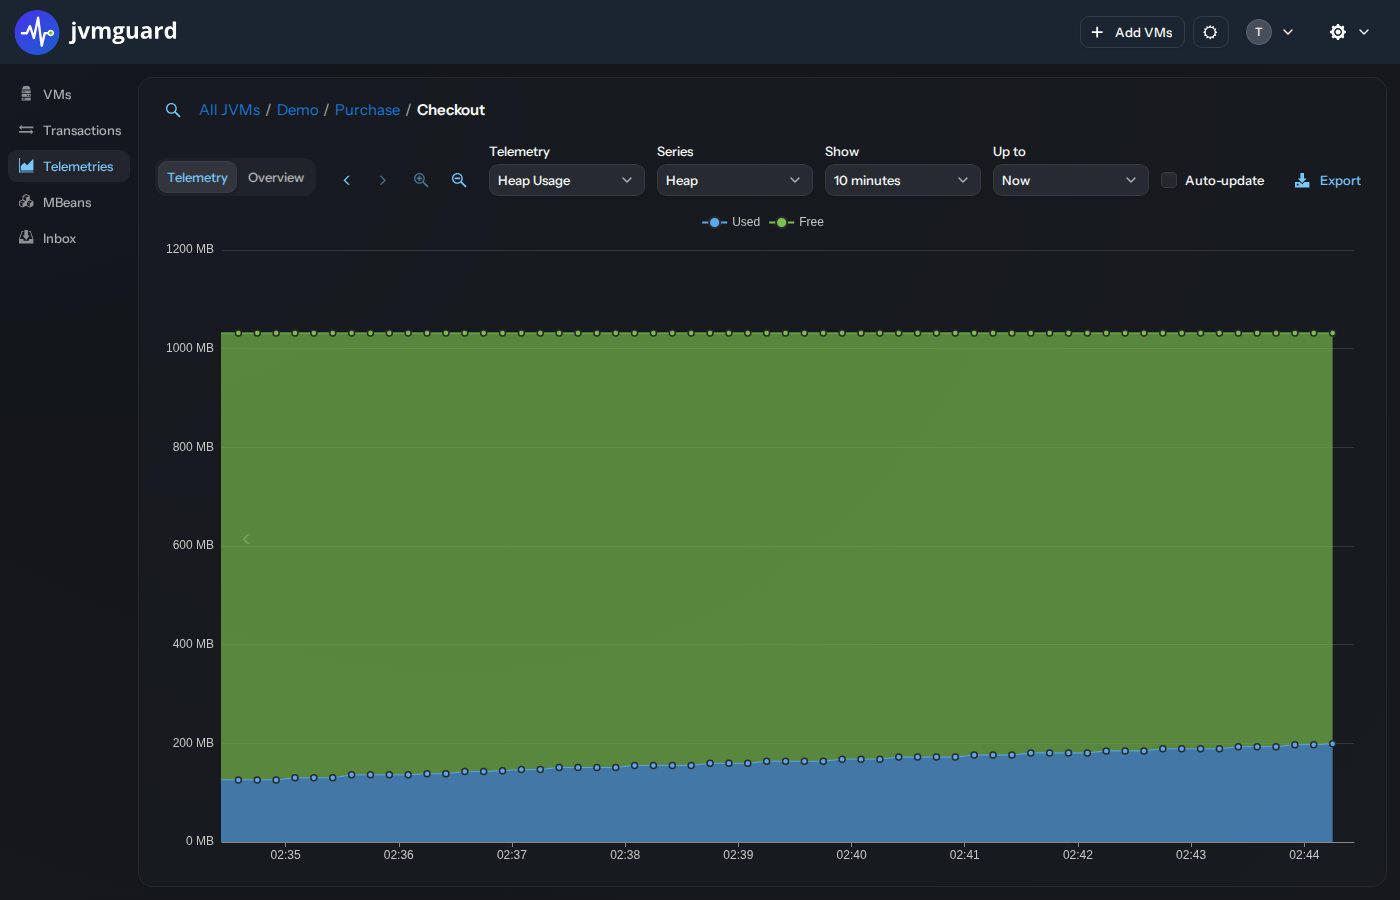
Detailed numbers can be obtained by hovering the mouse over the graph. In stacked area plots, you can toggle single data lines by clicking on the legend items.
In the context menu of the telemetry, there are actions for jumping to related views at the selected point in time. For all telemetries you can jump to the call tree and hot spots views.
Sparklines
Section titled “Sparklines”The VMs view shows small versions of the current telemetry data as so-called “sparklines”. Sparklines do not have labeled axes and are intended to give a visual impression of the recent development of an observed scalar value. The graph is followed by the current numeric value. The superscript indicates the observed maximum value, the subscript the minimum value in the displayed time range.
When you select the “Telemetries” view, the “Overview” tab shows all telemetries as sparklines for the last hour and the last day while the current value together with maximum and minimum values is shown in a separate column.
In the “VMs” view, you can configure a set of sparkline columns. This allows you to make a relative assessment of the different VMs and VM groups with respect to the monitored value. Sparklines can be scaled separately, with a common scale for each group or with a common scale for all VMs.
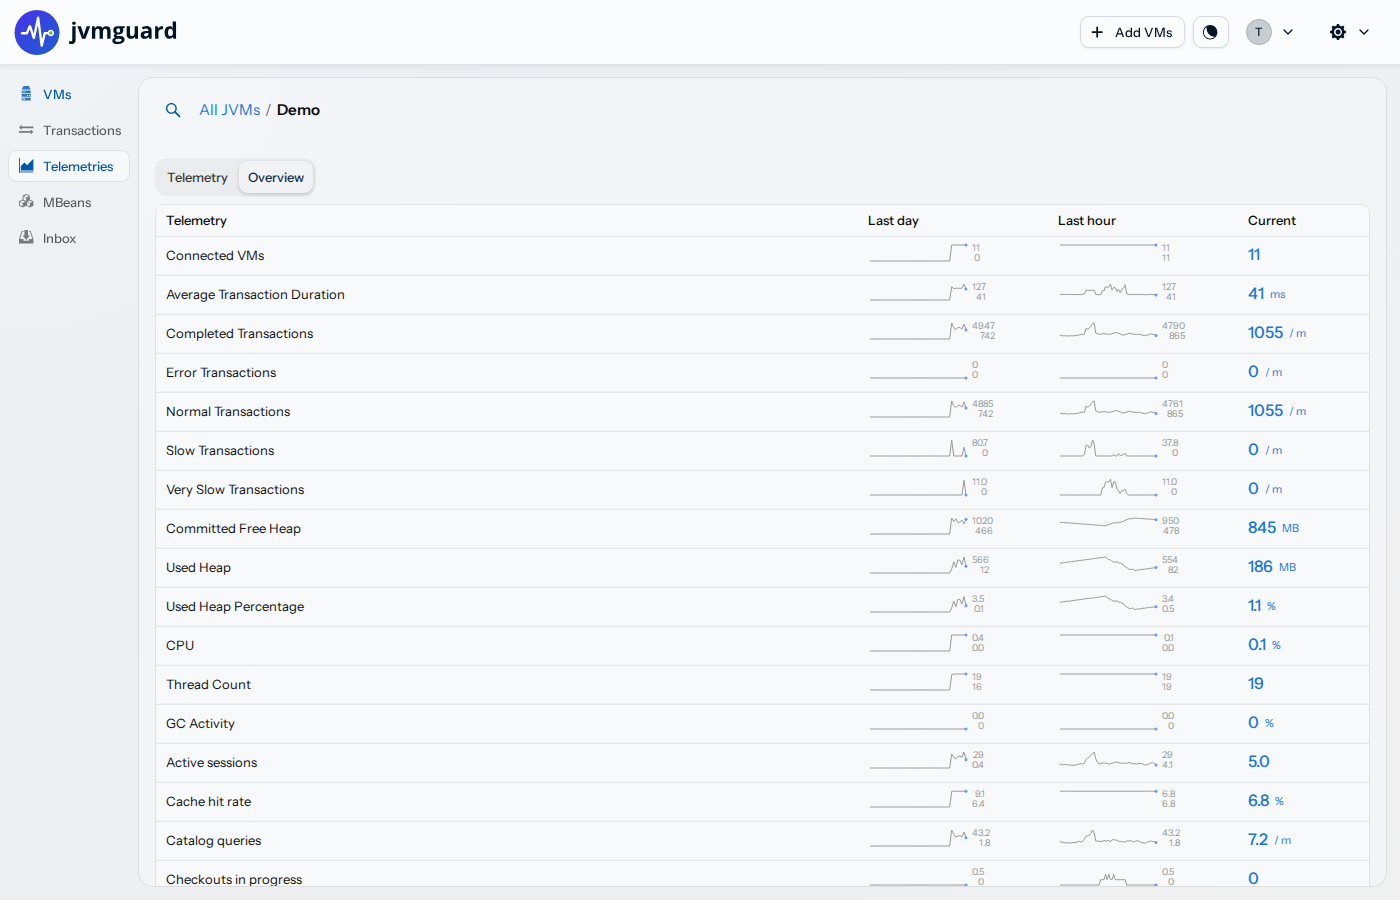
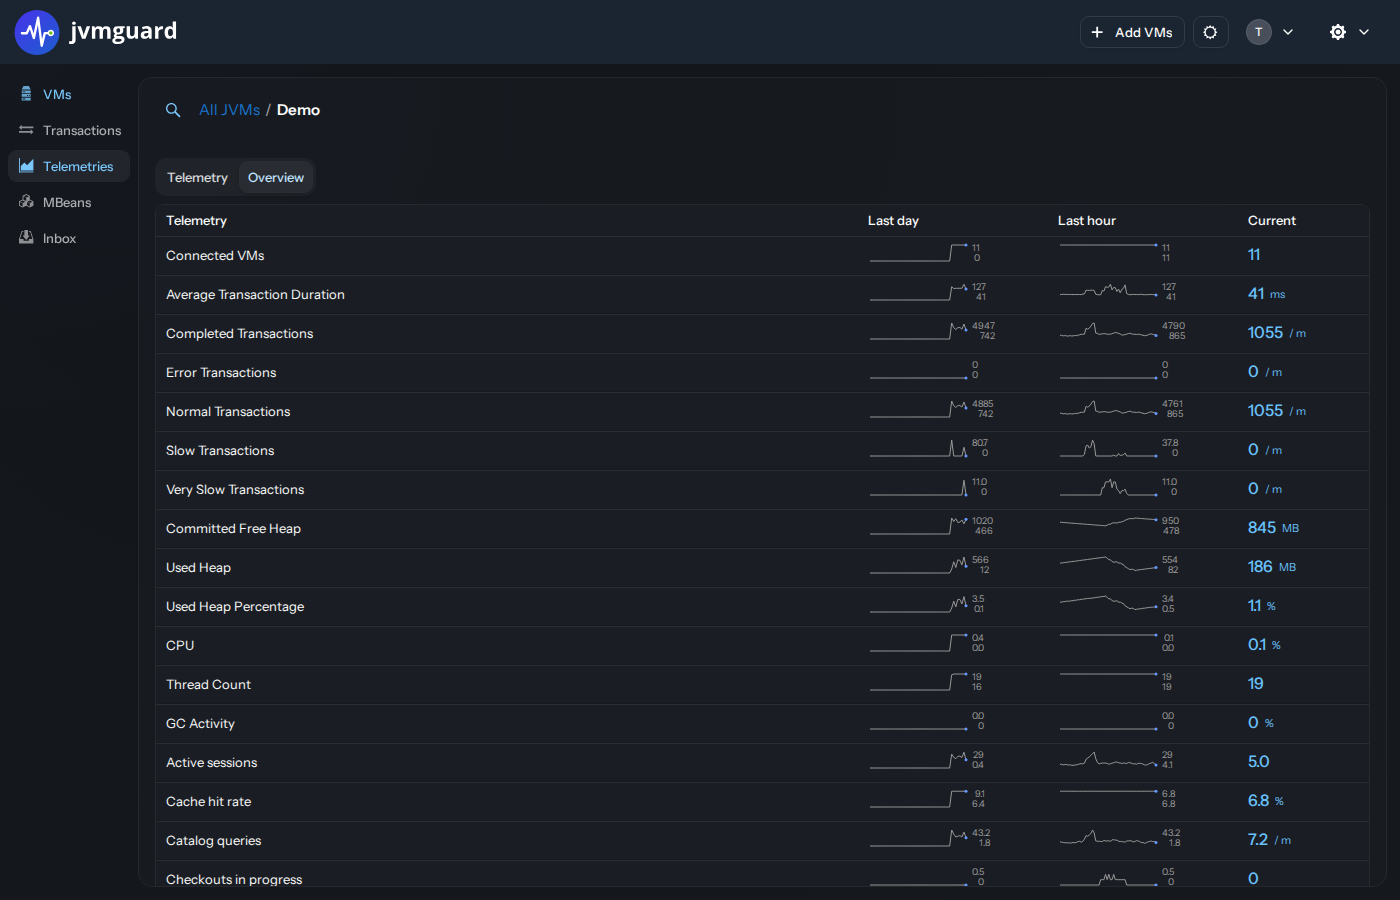
The set of sparkline columns is chosen from the “Telemetries” selector in the toolbar of the “VMs” view.
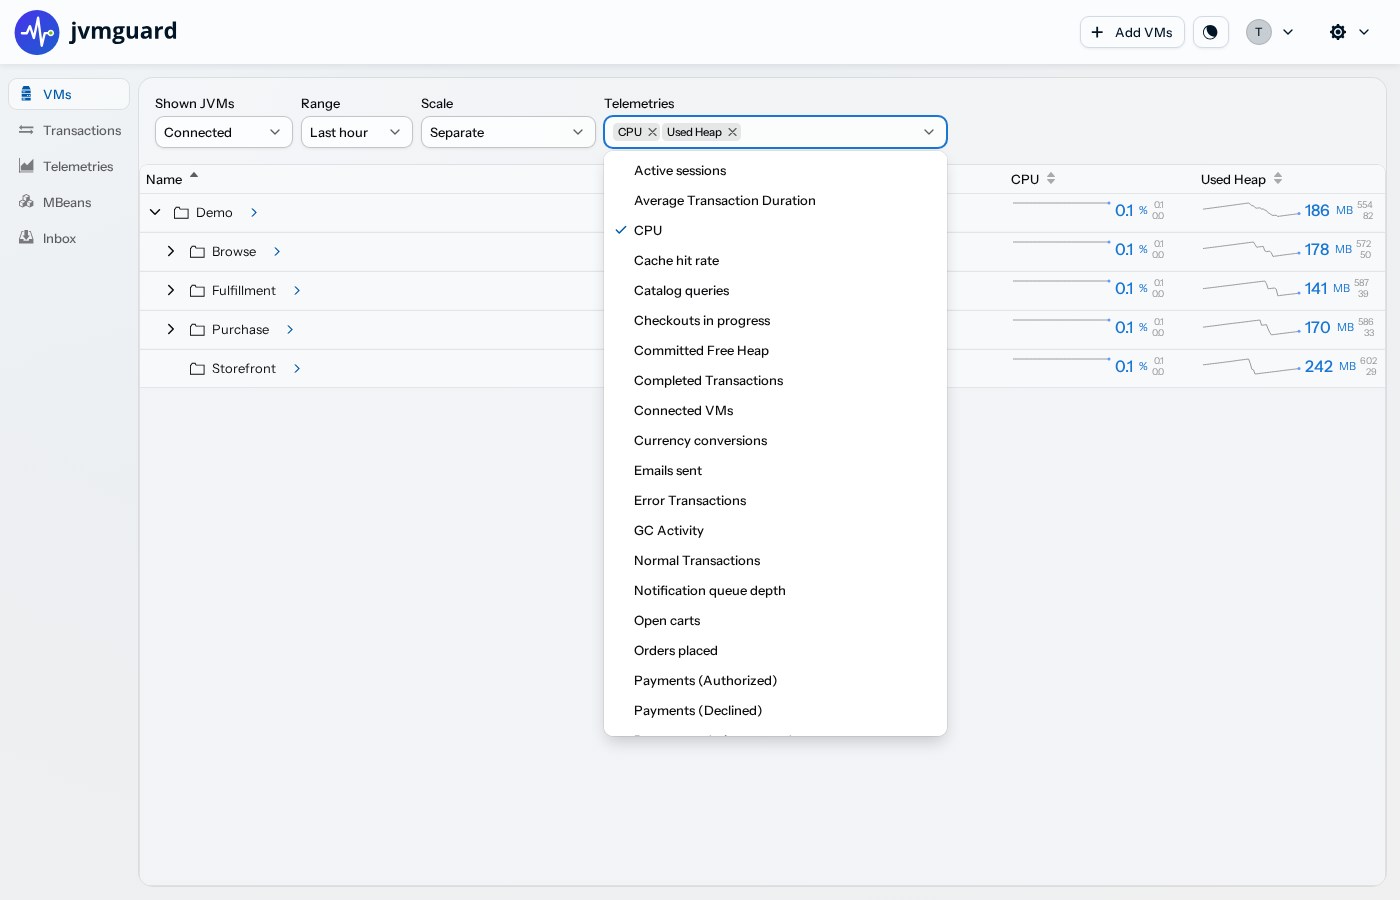
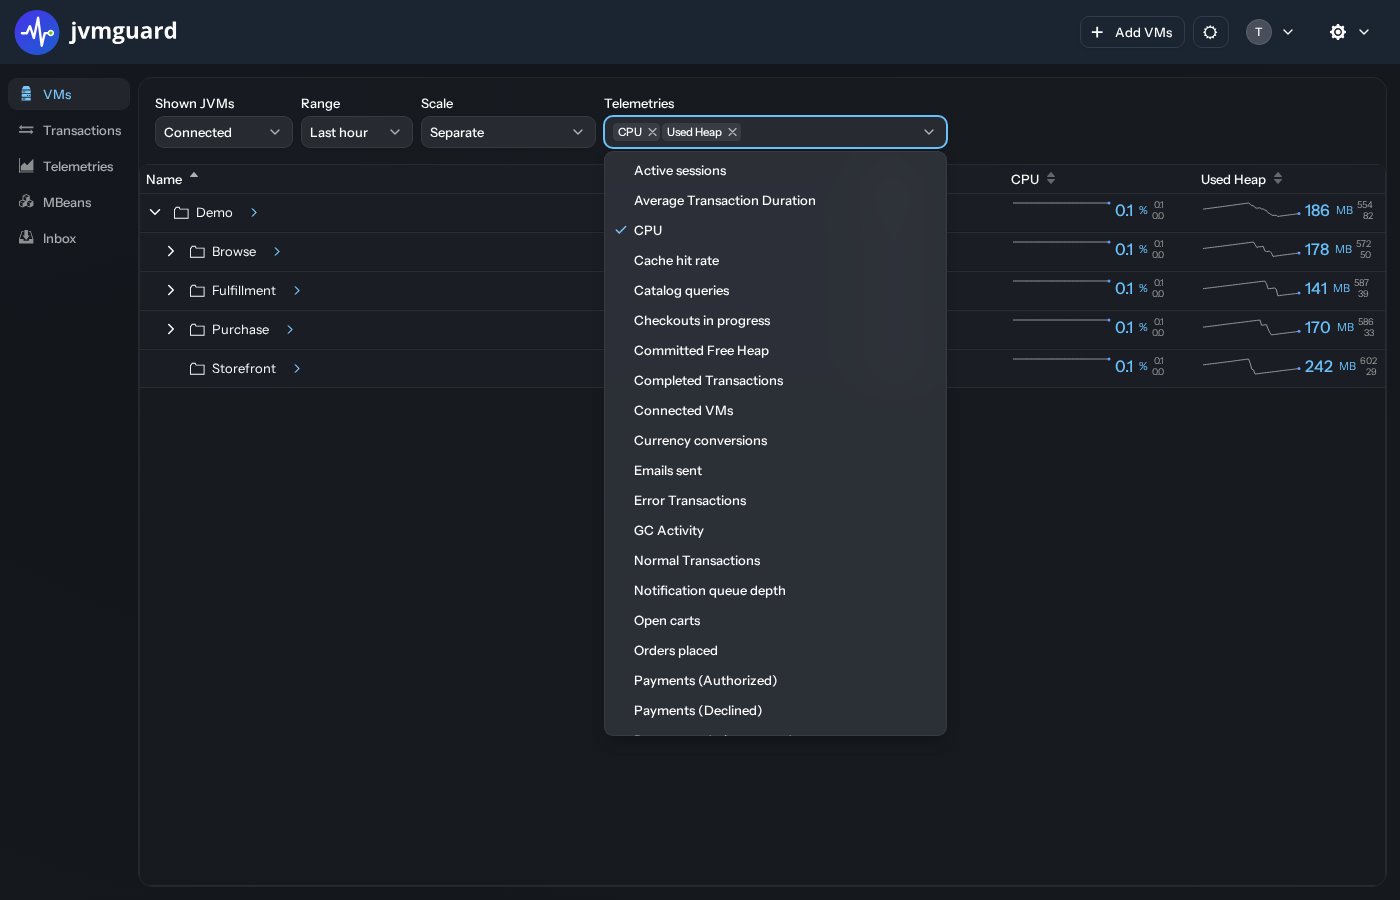
By clicking on a sparkline in the “VMs” view or the telemetry overview, the full telemetry view is activated with a time interval that most closely corresponds to the interval that was shown in the selected sparkline.
MBean telemetries
Section titled “MBean telemetries”Many application servers and frameworks publish MBeans with values that are interesting for monitoring purposes. All numeric values that are published by an MBean can be polled by the jvmguard agent and become part of a telemetry. To this end, it is not necessary that a JMX server has actually been opened to the outside. It is enough if an MBean was registered with any MBean server internally.
In the “Telemetries” step in the recording settings, you can add MBean telemetries and their telemetry lines. The telemetry defines the name of the telemetry, the unit, and its overall behavior while the telemetry lines define the actual data.
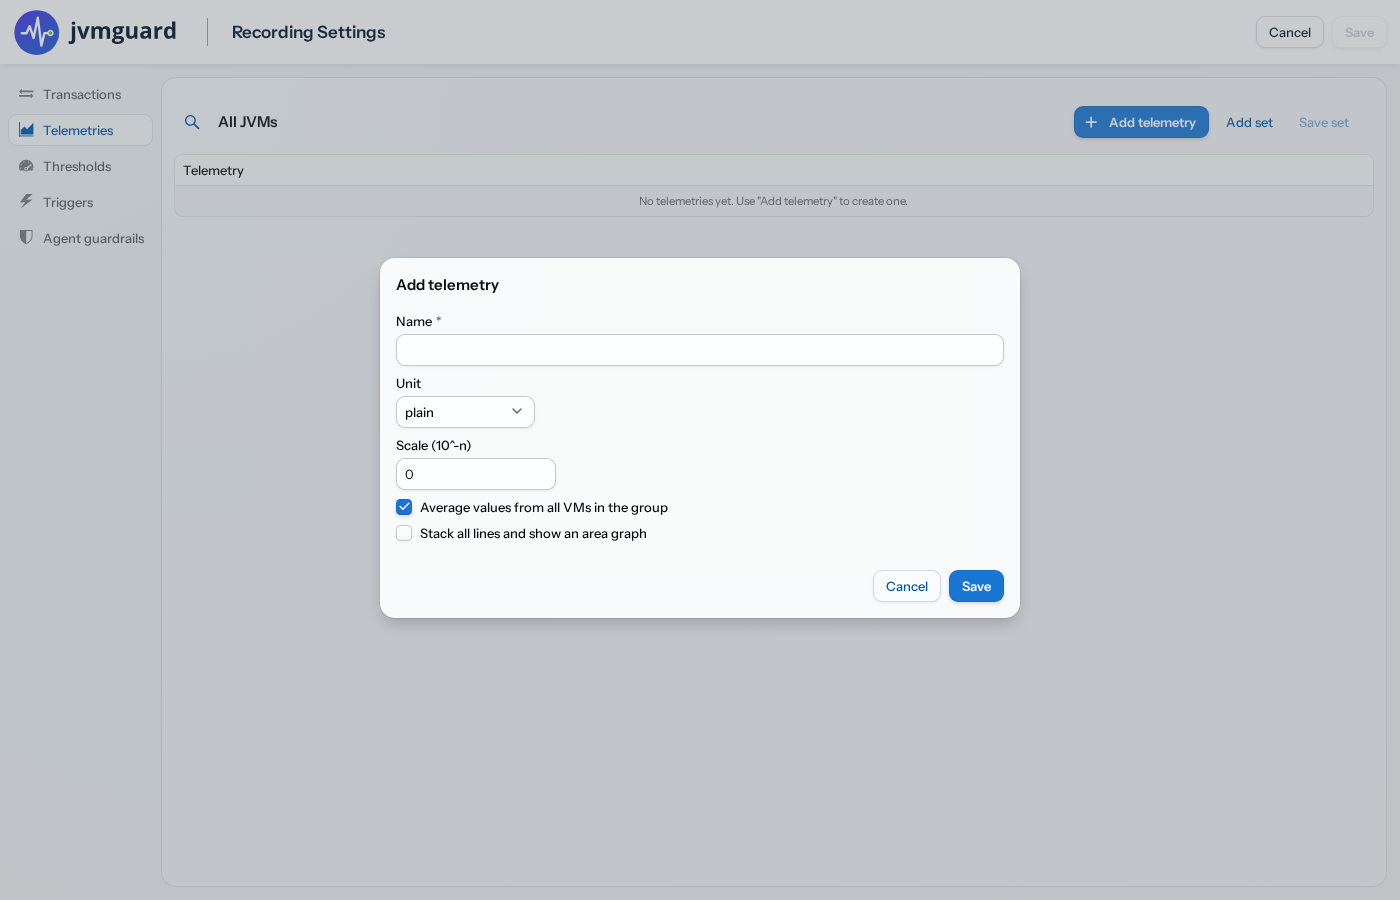
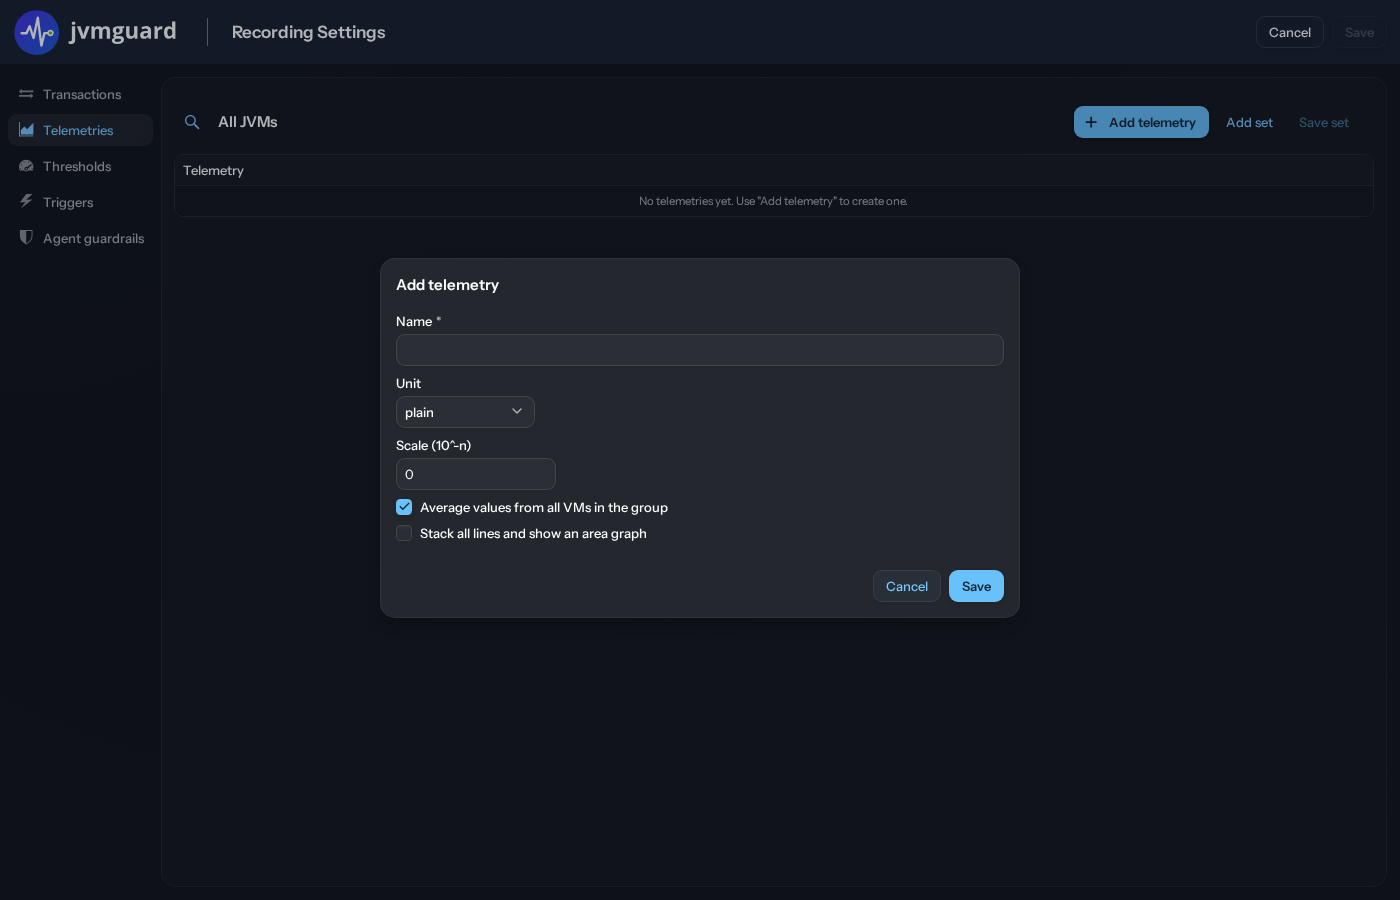
If the telemetry lines are parts of a total value, you can stack them into an area graph. If the monitored values from different VMs should be averaged, choose the “Average values from all VMs in the group” otherwise the values will be summed. Summing makes sense for business measurements such as “number of logged-in users” or the use of a shared resource such as “number of database connections”.
The configurable units are base units and unit prefixes will be added as required. For example, if you select the “bytes” unit, large values in the telemetry will be shown as “kB”, “MB” and “GB” automatically. Sometimes a scale factor has to be applied to get from the recorded value to the selected unit. You can add that scale factor as a negative power of 10. For example, to multiply by 0.01, the scale factor is 2.
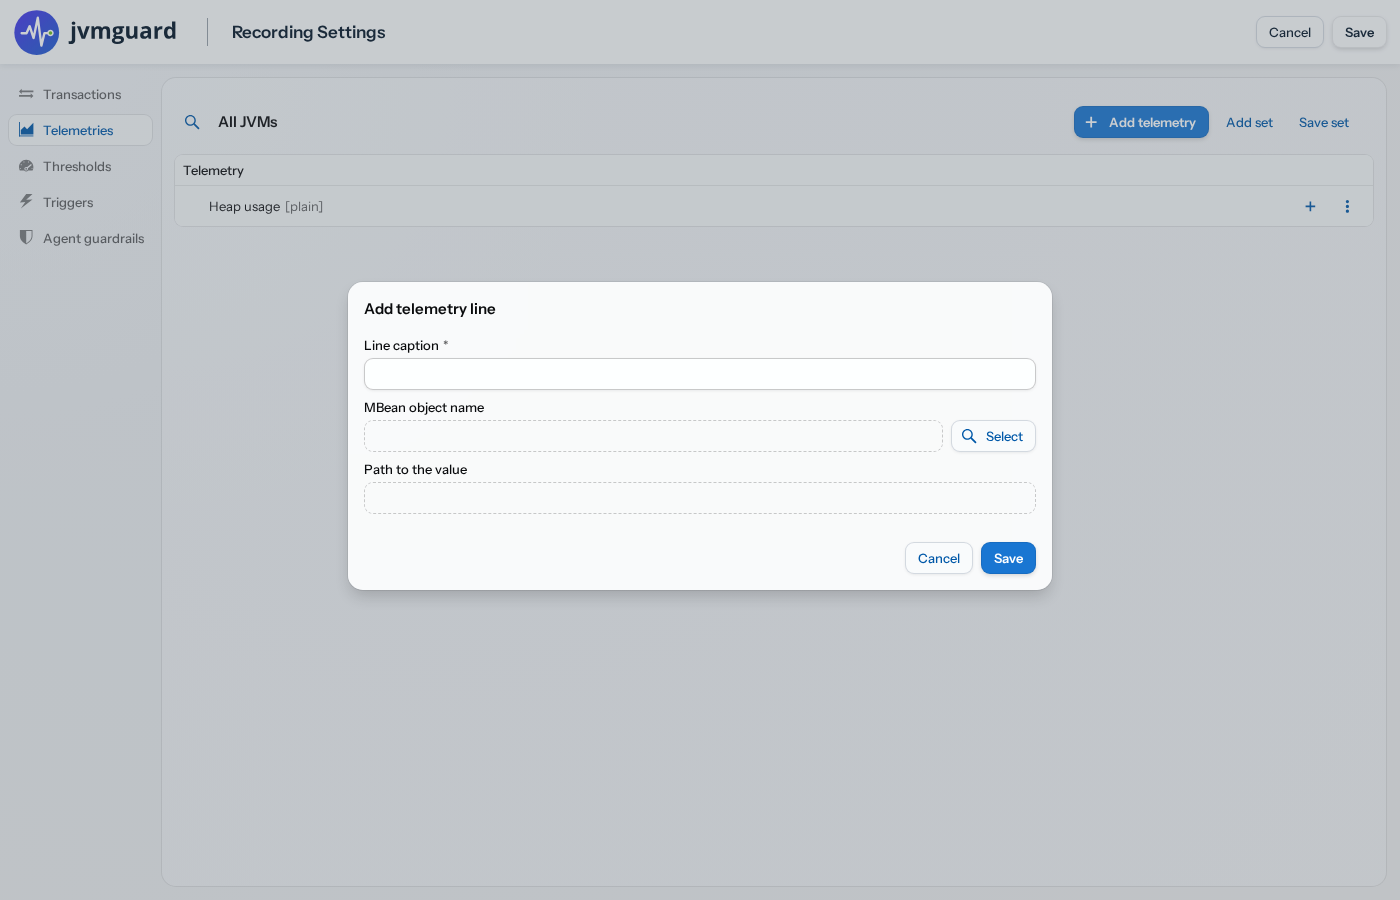
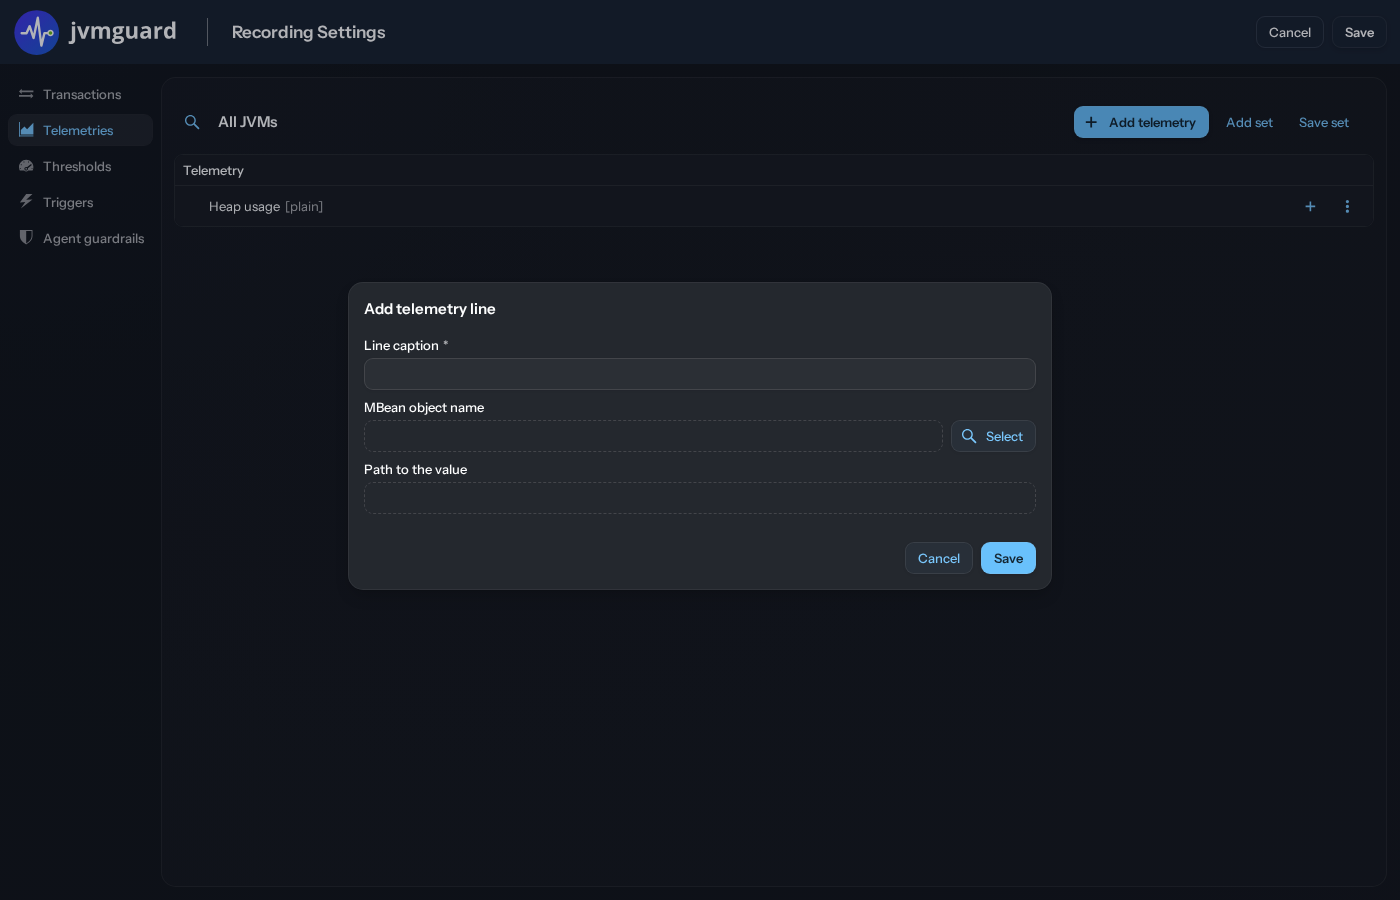
Each MBean line is defined by an MBean object name and an MBean value path. You can most easily obtain these settings by clicking on the Select button in the MBean line configuration dialog. An MBean attribute browser is shown that allows you to select a numeric value from one of the monitored VMs. The configured line names are shown in the legend of the telemetry.
jvmguard will not create the platform MBean server if it does not exist, so if you configure a telemetry from the platform MBean server, you must call
ManagementFactory.getPlatformMBeanServer();in your application at startup to be sure that the telemetry will work after a restart of the monitored VM.
Declared telemetries
Section titled “Declared telemetries”To monitor any scalar value in your application, you can add a public static parameterless method that returns a
numeric value, either a primitive or a primitive wrapper. Then, annotate the method with the
@Telemetry annotation.
You have to make sure that the containing class is actually loaded, otherwise jvmguard will not detect the annotated
method.
You can display the custom telemetry by going to the “Telemetries” view and locating the telemetry in the telemetry drop-down.
Once an annotation telemetry was detected by jvmguard, it will always be shown in this list, regardless of whether the annotated method is currently available in a connected VM. When you retire such a telemetry, go to the general settings, open the Display tab and use the Hidden Declared telemetries selector. Here you can hide selected telemetries. Note that the telemetries are matched by name and not by the annotated method.
For more information, please see the Javadoc of the dev.jvmguard.annotation.Telemetry
class, also present in the api/doc directory of your jvmguard
installation.
Time zones
Section titled “Time zones”All displayed times are expressed in the time zone of the server. If you are in a different time zone, there will be an offset between the displayed times and your local wall clock time.