UI
The data views
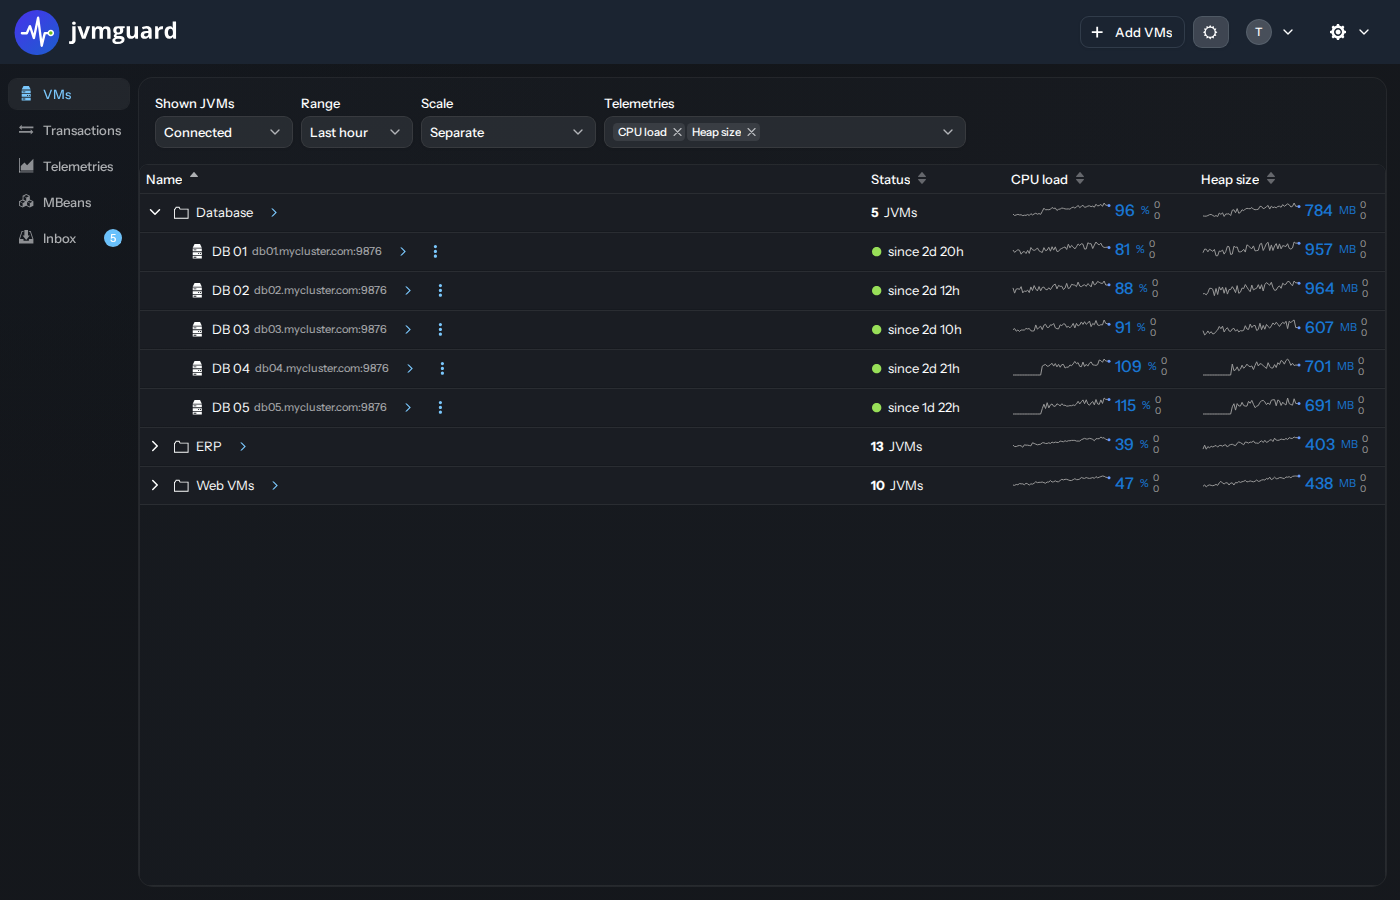
Section titled “The data views”The left side-navigation holds the main views. The VMs view is the home view. It shows you the hierarchy of all connected VMs, together with selected information in the form of sparklines.
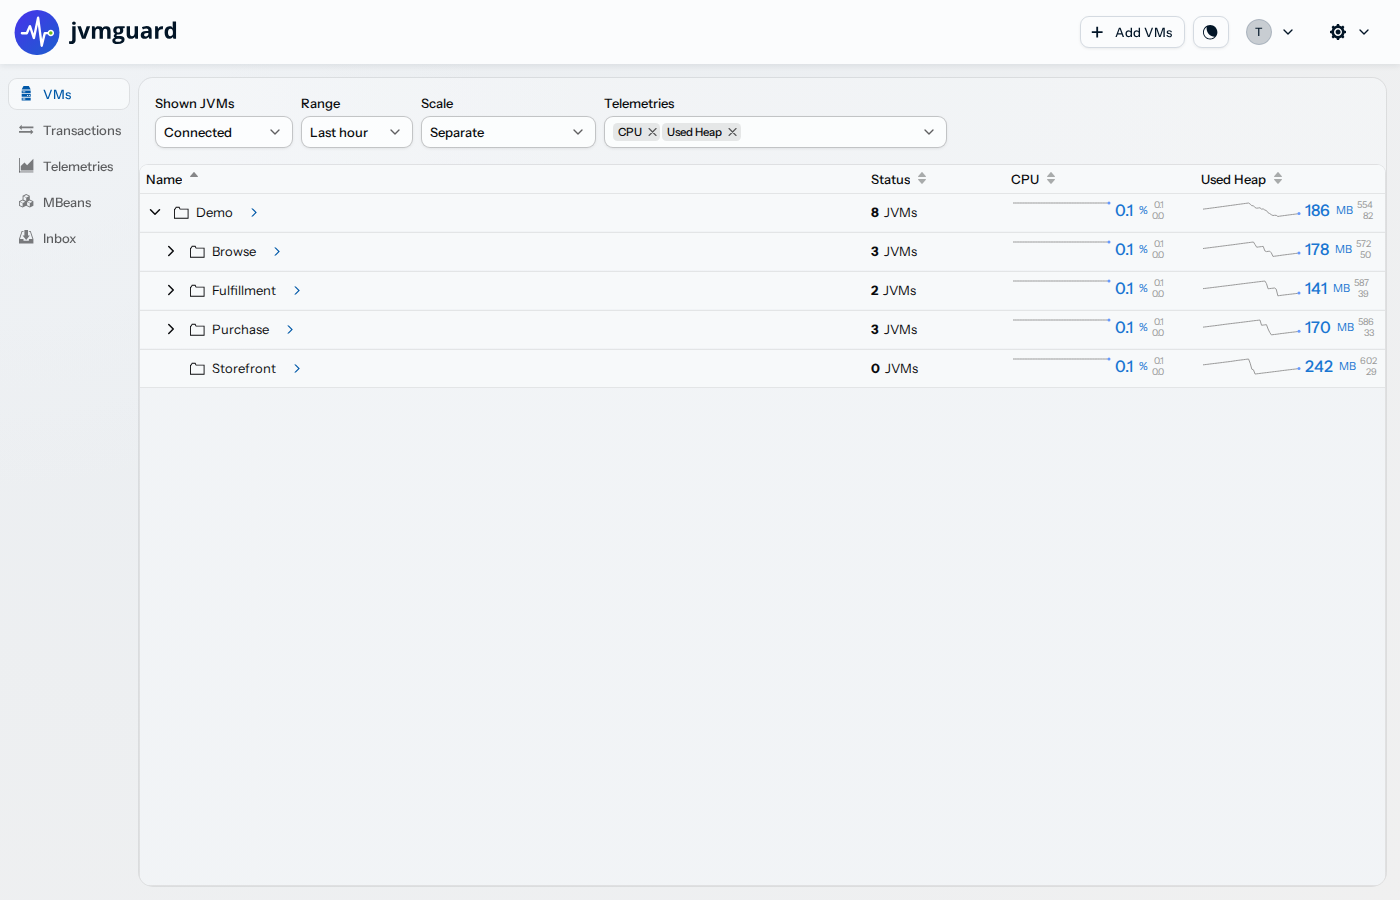
From the VMs view you reach the per-VM data views for a selected group or VM. They provide access to all recorded data that is available for your selection, including the telemetry views, the transaction call tree and hot spots, and the MBean browser. You use the arrow-shaped view selector context menu of a row to open these views. Clicking on a sparkline takes you to the full telemetry view.
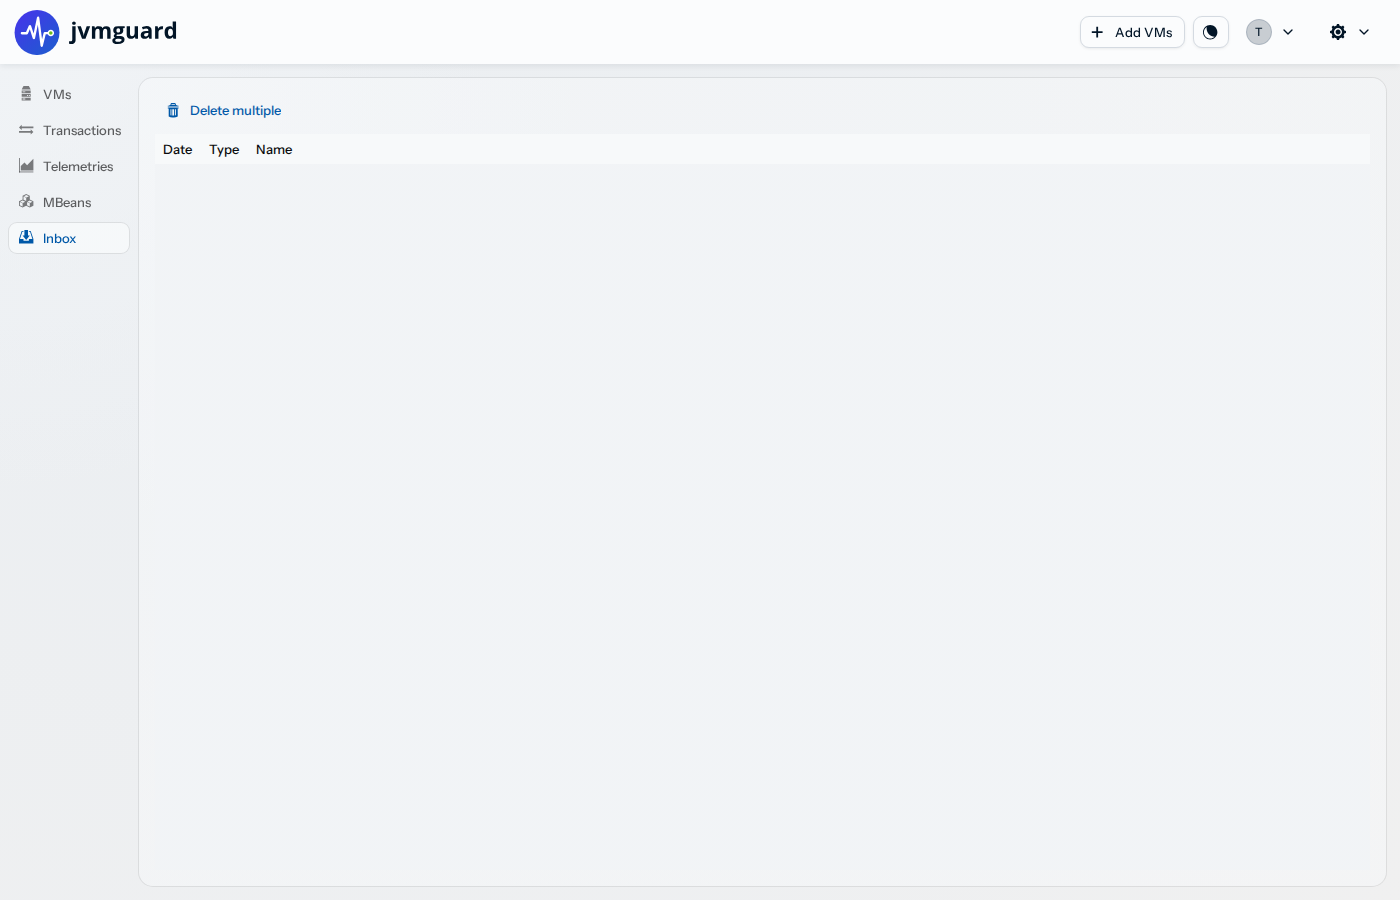
The inbox view shows all messages that have been sent to you. For example, if you record a JProfiler snapshot on a particular VM, a notice will be sent to your inbox once the snapshot is ready for downloading. If there are unread messages, the inbox entry in the side-navigation shows a notification badge.
The server logs are available from the side-navigation as well and let you inspect the server, connection, audit and event logs without leaving the UI. Each has a different scope and a different required access level:
- The event log (viewer access) is the monitoring feed for your applications. An entry is written whenever a trigger fires or a diagnostic snapshot is captured, in addition to any trigger with an explicit “write to the event log” action. It stays empty until one of these happens.
- The connection log (profiler access) records agent connectivity and data-collection activity.
- The audit log (administrator access) records security-relevant API access, artifact downloads, and authentication failures and authorization denials, so you can reconstruct what an API client or AI agent did. Each entry is a single-line JSON object with the caller, the client address and the outcome. A state-changing call also records what it changed: an MBean attribute write logs the object name, attribute, prior value and new value, an operation invocation logs the signature, arguments and return value, and a configuration edit logs the group with before and after content hashes. If you see unwanted activity, you can revoke the API key of the offending user with the Revoke API key row action in Users & Roles view of the general settings.
- The server log (administrator access) contains the general server diagnostics.
When you run jvmguard from a development build without a -Dlogging.config=… VM option, the server only logs to the console and not to files, so these views can be empty even though you have access.
Configuration
Section titled “Configuration”The cog drop-down in the header gives you access to two parts: general settings and recording options. If you want to view and edit general settings, you have to be an administrator. Recording options can also be edited by the “profiler”, but not by the “viewer” access level.
As long as you do not change anything, you can simply leave a settings view with the “Cancel” button in the header again. If you made a change, the Save button is enabled. No changes to the configuration have any effect before you save them.
General Settings
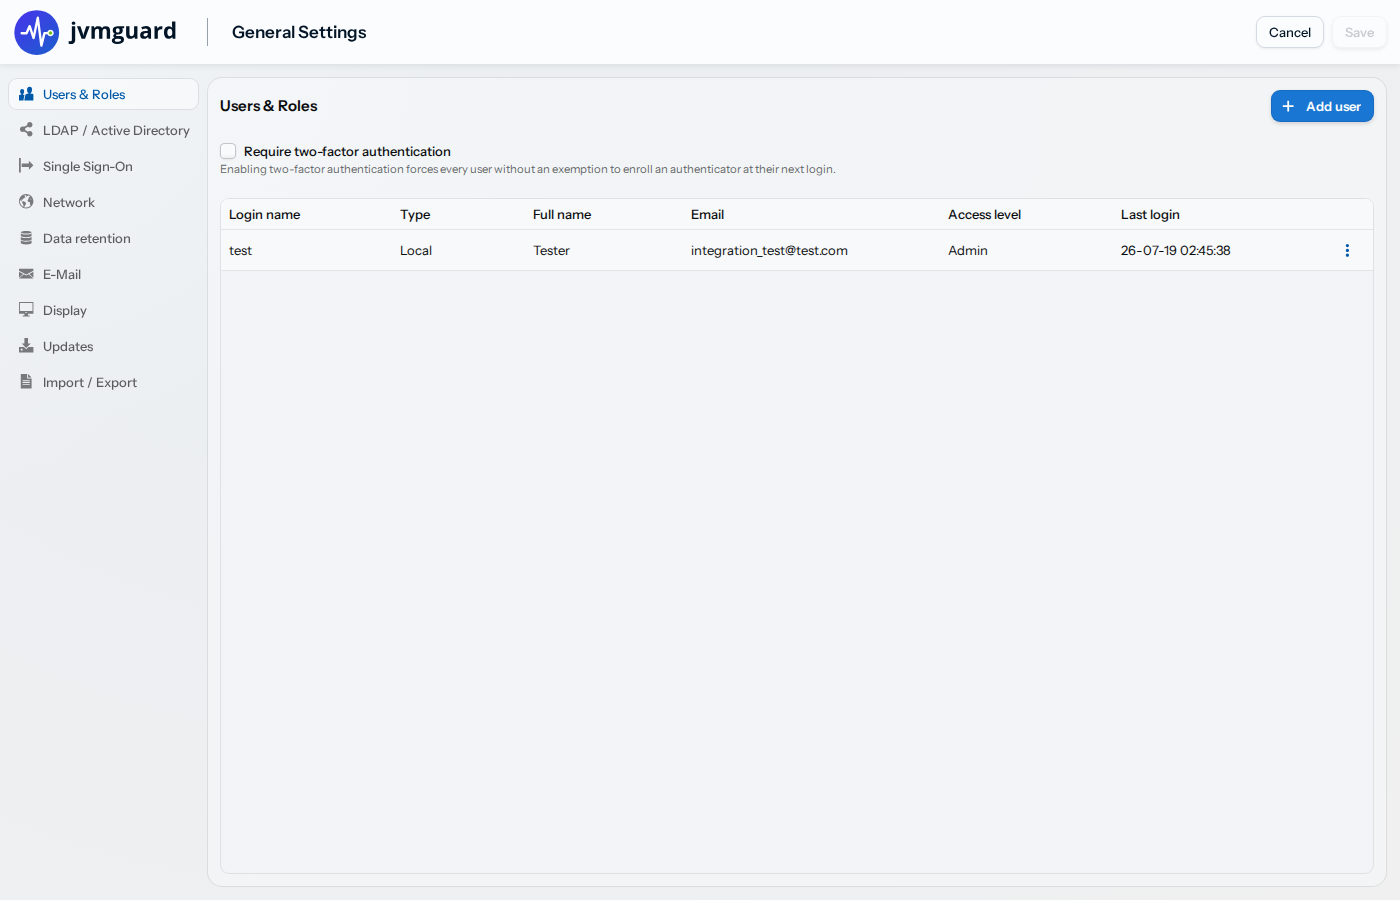
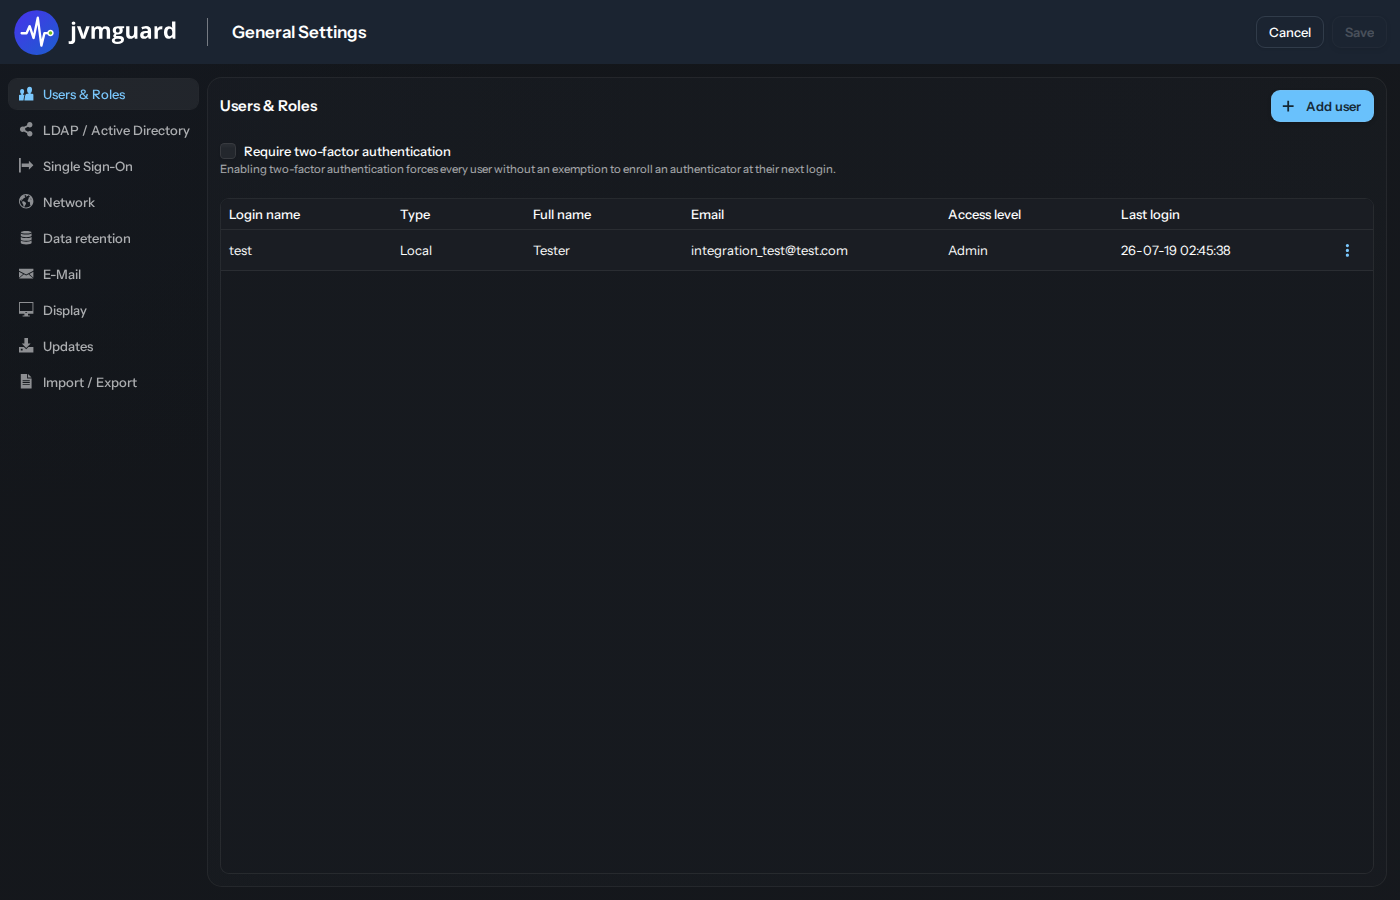
Section titled “General Settings”In the general settings you administrate the jvmguard server. This includes
- the users and their access levels
- single sign-on providers
- data consolidation options
- SMTP access
- network access for AI agents and REST clients
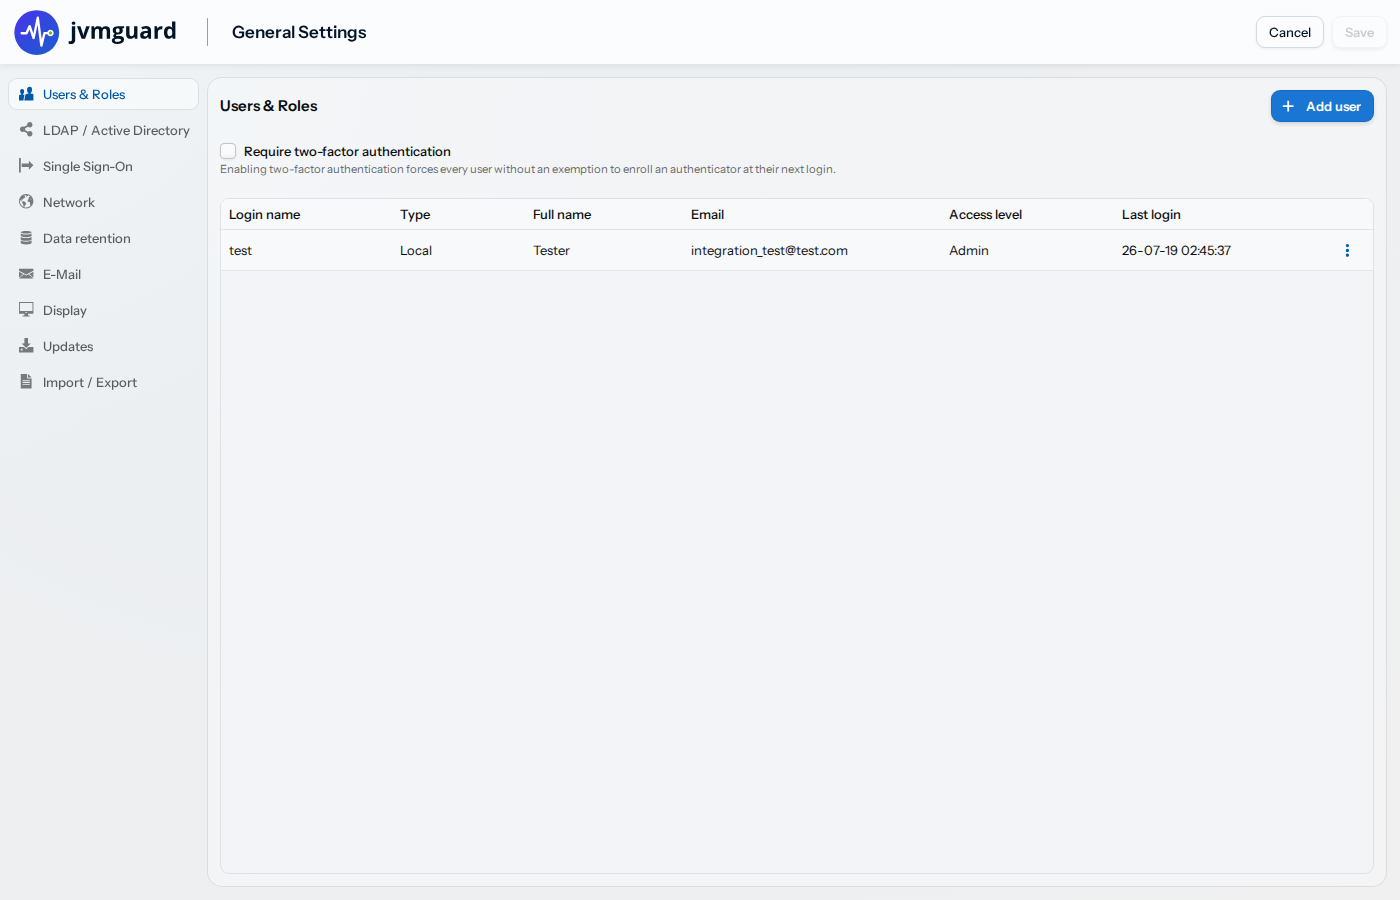
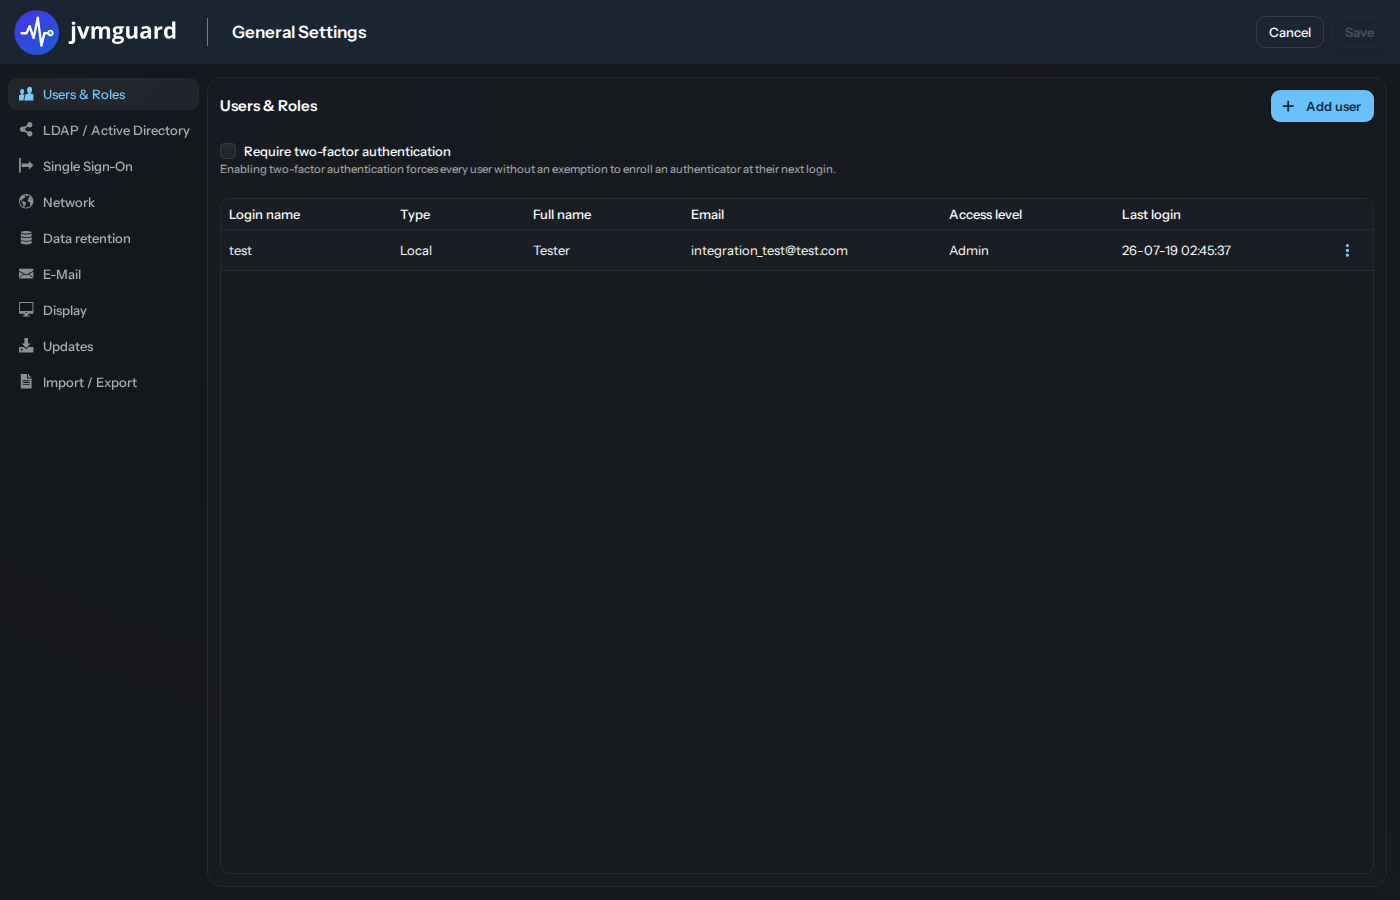
In addition, you can export and import the entire server configuration.
Network
Section titled “Network”The Network tab holds the server-wide restrictions on what an AI agent over the MCP server or a REST client may do. All settings are permissive by default.
- MCP access has the read-only mode switch, which blocks every mutating and capturing tool over MCP and
leaves only read access. Per-VM-group restrictions on individual captures
and mutating actions are available in the recording settings (see Agent guardrails below). When the MCP
server is disabled in the server configuration (
application.yaml), read-only mode has no effect and is shown disabled. - Allowed IP addresses is an allowlist of IPv4/IPv6 addresses or CIDR ranges permitted to talk to the MCP server and the REST API. Because it guards both, it stays active as long as either is enabled and is only disabled when both are off.
When a guardrail blocks a request, the reason is returned to the client so an agent can adjust its operations, and the denial is written to the audit log.
Recording & triggers
Section titled “Recording & triggers”Recording options and triggers are configured for each VM group. By default, “All JVMs” are selected for configuration. In the VM selection dialog, you can see directly which VM groups have their own configuration.
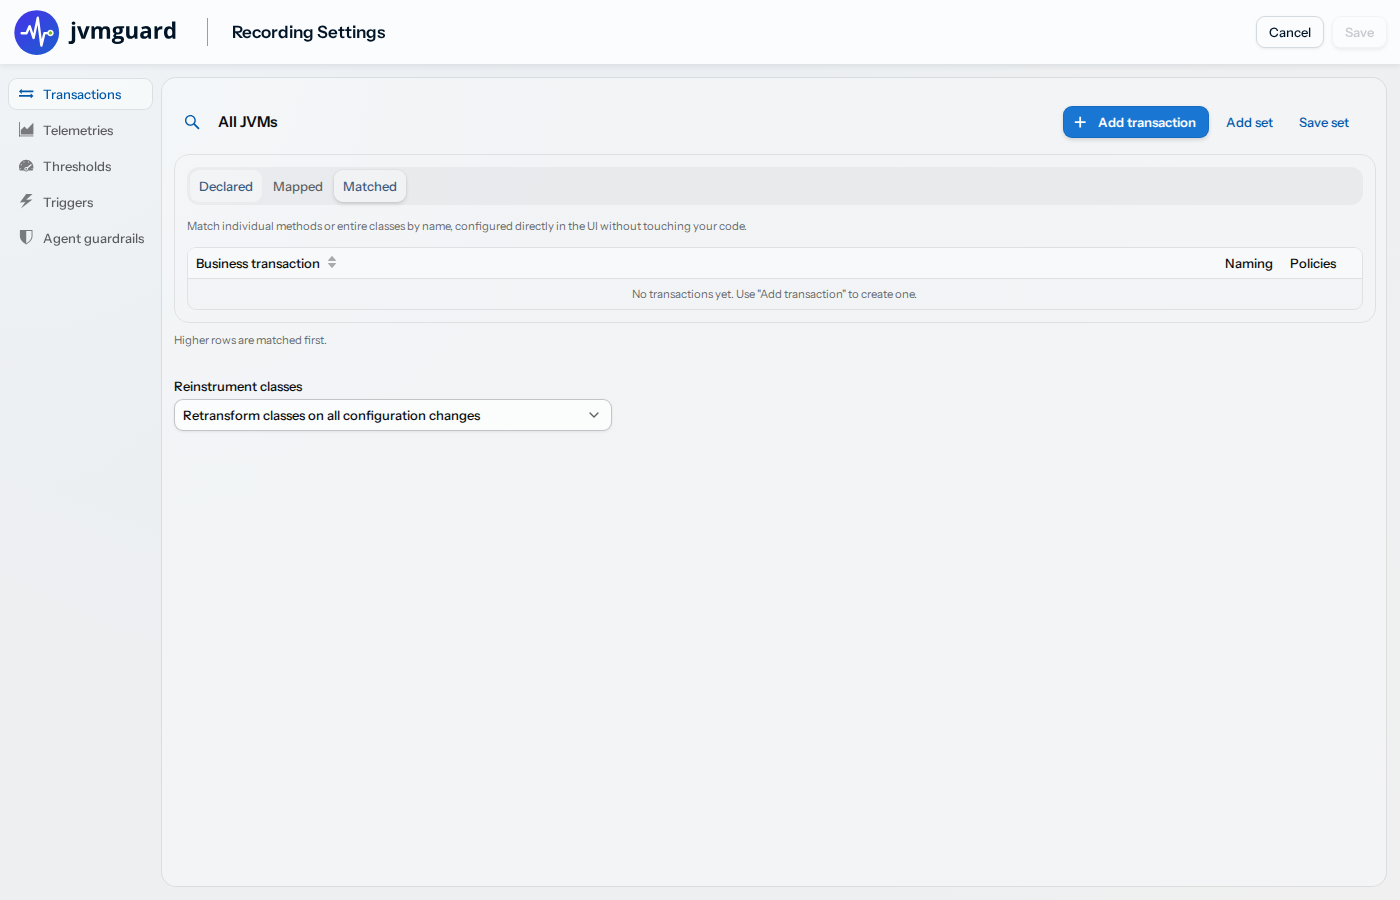
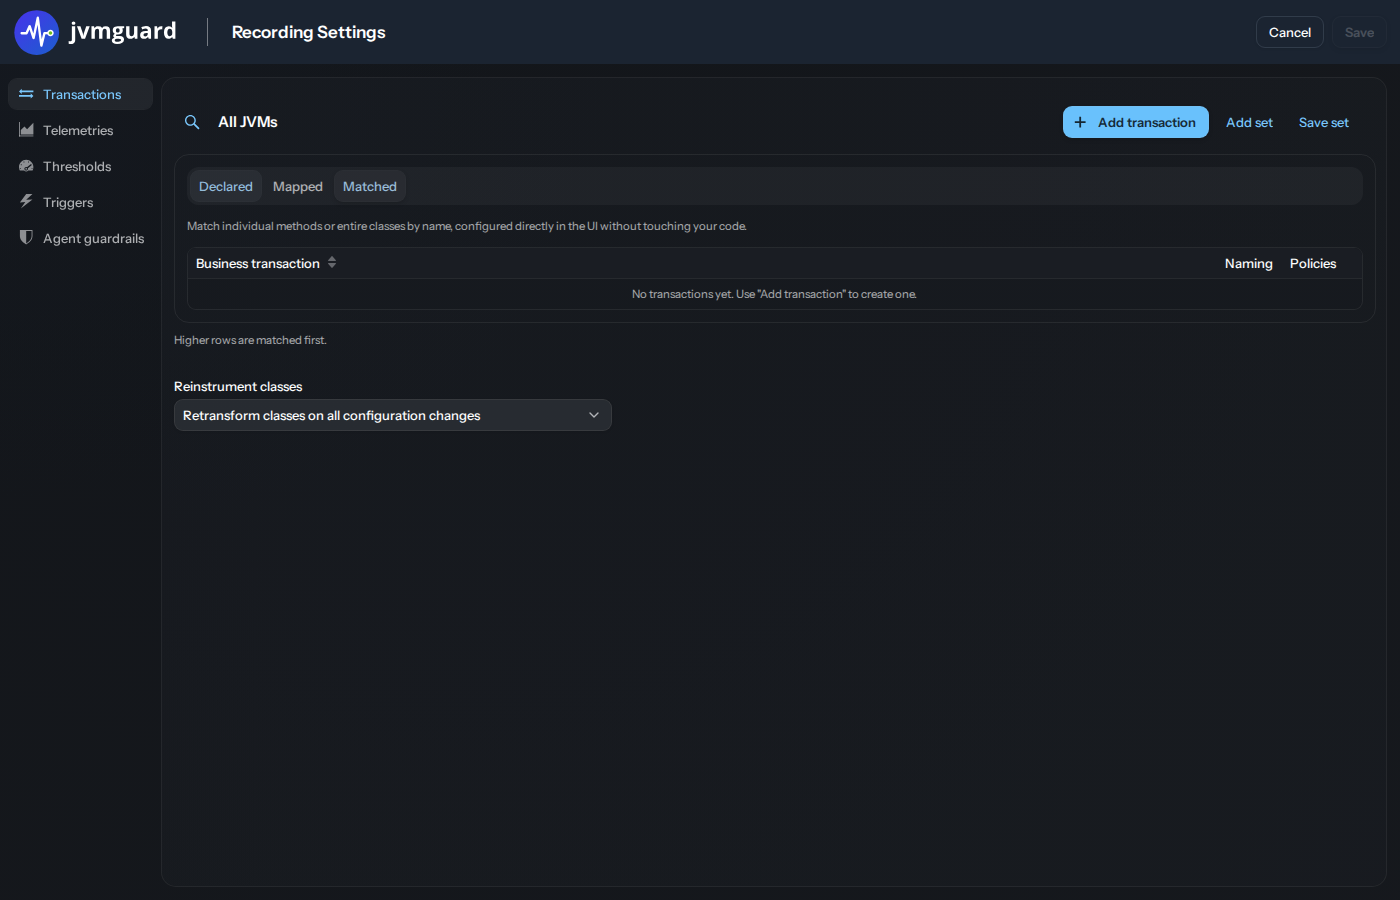
The configuration contains recording options as well as threshold and trigger settings. Recording options are sent to the monitoring agents in each connected VM. They are inherited to nested VM groups and nested VM groups can override settings in their parent groups.
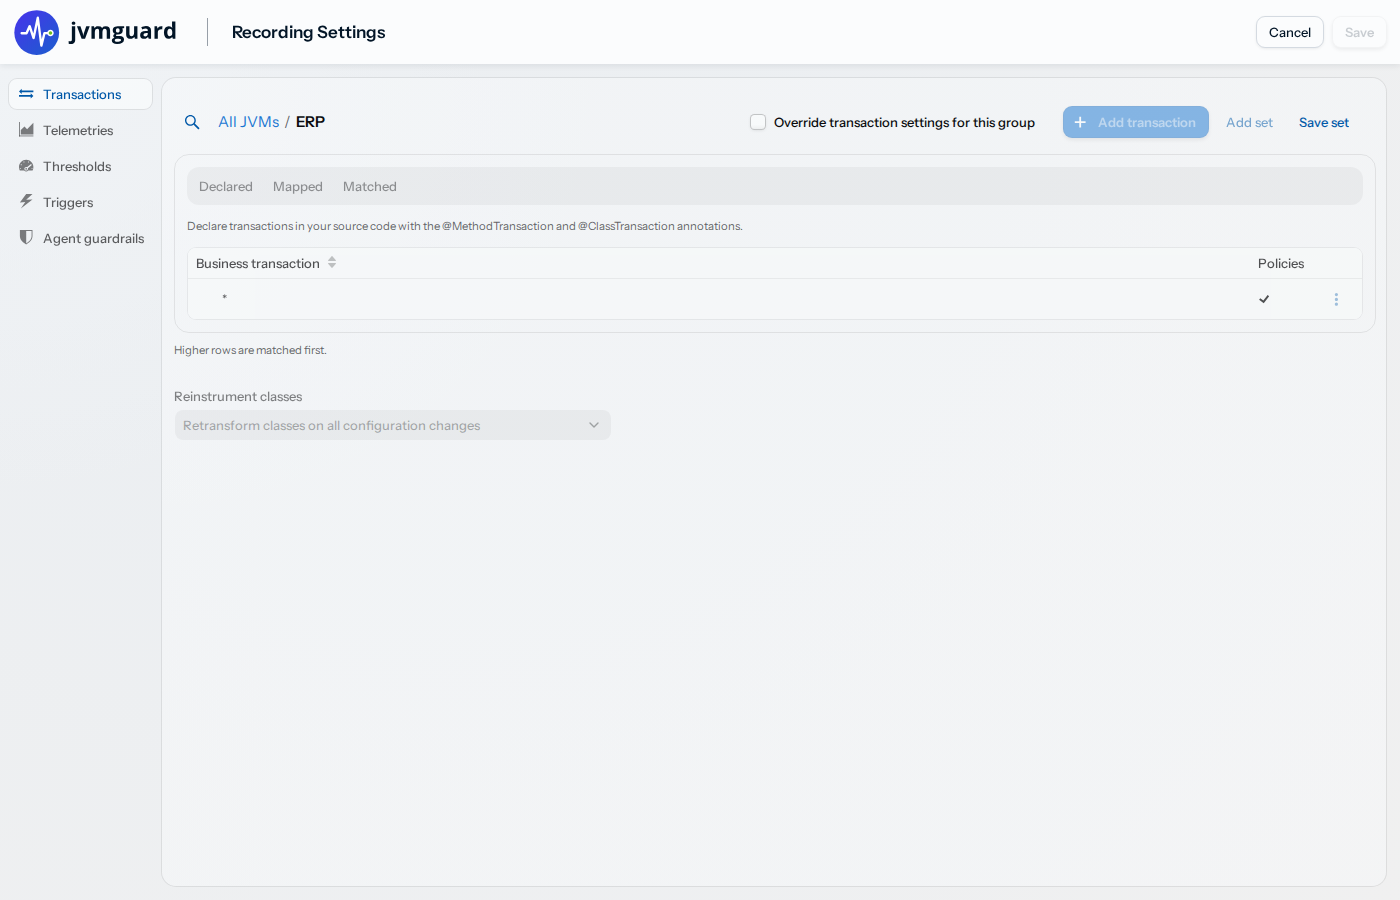
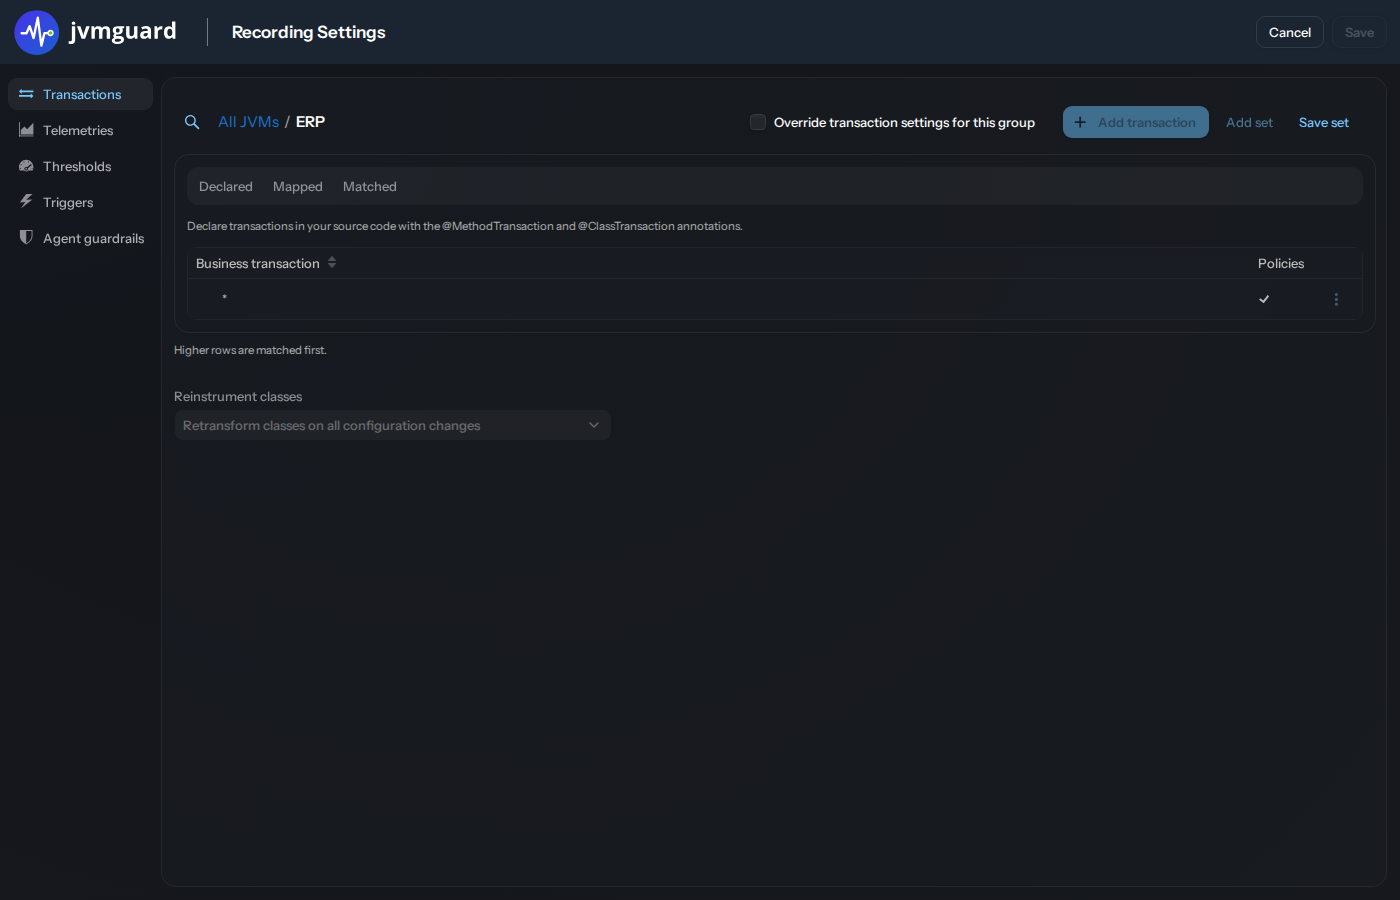
Thresholds and triggers, on the other hand, are handled in the jvmguard server and are processed for the VM group for which they have been defined. They operate on all VMs that are contained recursively in their VM group. If you need additional thresholds or triggers that operate only on a nested VM group, you can define them on that group.
Agent guardrails
Section titled “Agent guardrails”The Agent guardrails tab configures, per VM group, which diagnostic captures and mutating actions an AI agent or REST client may perform on the VMs of that group. A user with access level “profiler” who owns a VM group can manage them without administrator access.
- Diagnostic captures deny heap dumps, JProfiler snapshots or JFR recordings individually, cap the recording
duration, and set a minimum interval between captures on the same VM. With Redact heap dumps and JFR recordings by
default, always for agent recordings, snapshots captured for the group are stripped of sensitive data as they arrive on the server: all string
contents and primitive values in heap dumps are zeroed (the heap structure and object sizes are preserved for
analysis), and JFR recordings are scrubbed. On JDK 27 and later, system properties, environment variables and JVM
command-line arguments are already redacted in-process (JEP 536), so those events are kept with
[REDACTED]placeholders; note that the in-process redaction is filter-based — keys that do not match the JVM’s default filters stay visible, and you can widen the filters with-XX:FlightRecorderOptionson the monitored JVM. On older JDKs the event types that routinely carry secrets — system properties, environment variables and process command lines — are dropped. Interactive users can still override the default for a single capture; agent recordings through the MCP server cannot turn redaction off while the guardrail is enabled. - Mutating actions deny actions that change a running VM without producing an artifact, such as invoking MBean operations or editing the recording configuration of a VM group.
Like the other recording settings, a group inherits its parent’s guardrails until you select Override agent guardrails for this group, and the server-wide read-only mode still overrides everything. When a guardrail blocks a request the agent is told why, and the denial is written to the audit log.
User settings
Section titled “User settings”The user drop-down in the header shows selected information about your account and the current session and contains the Logout button that terminates your jvmguard session.
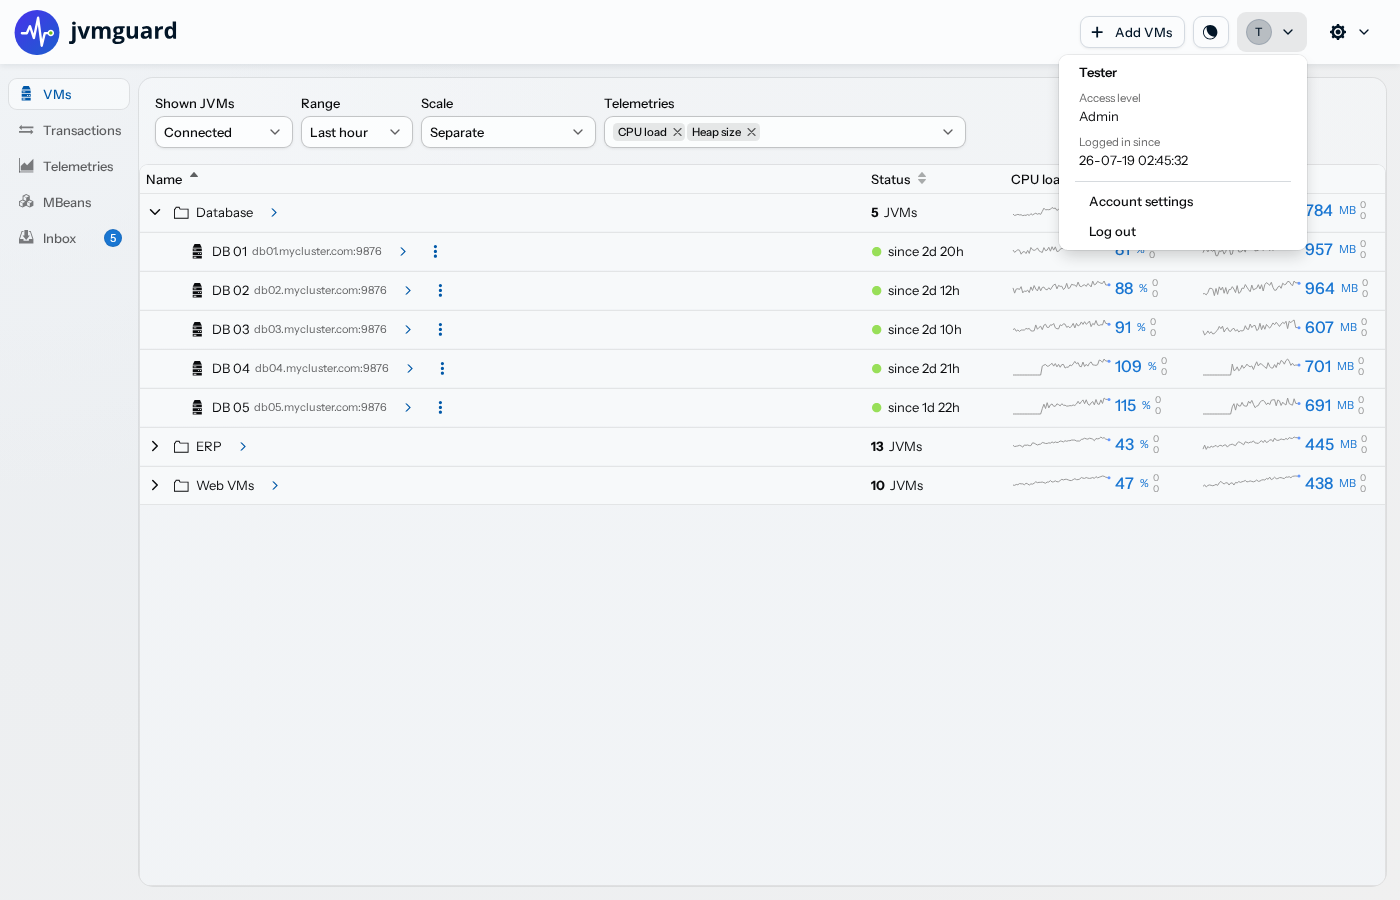
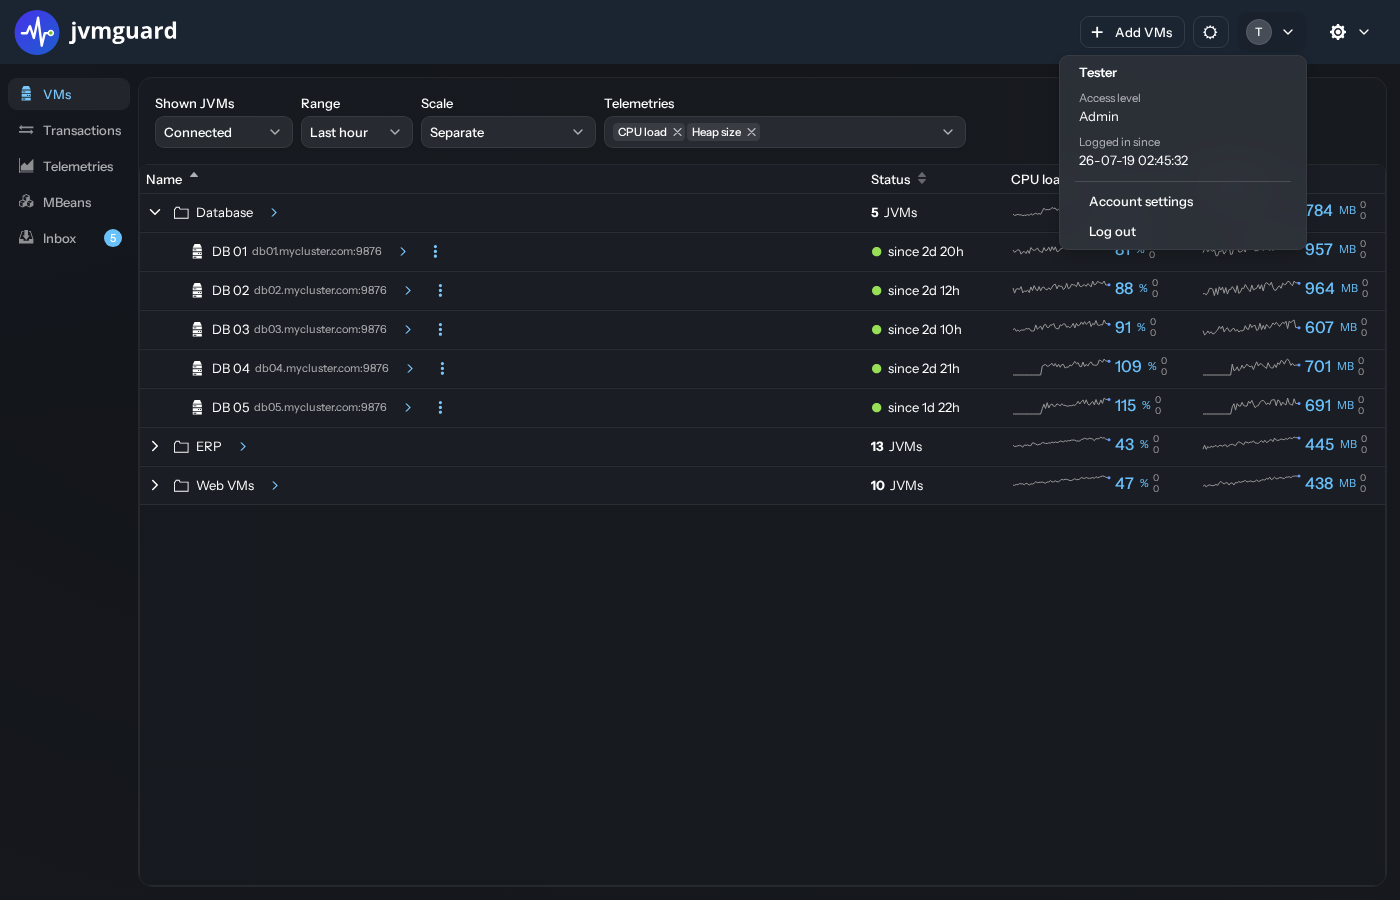
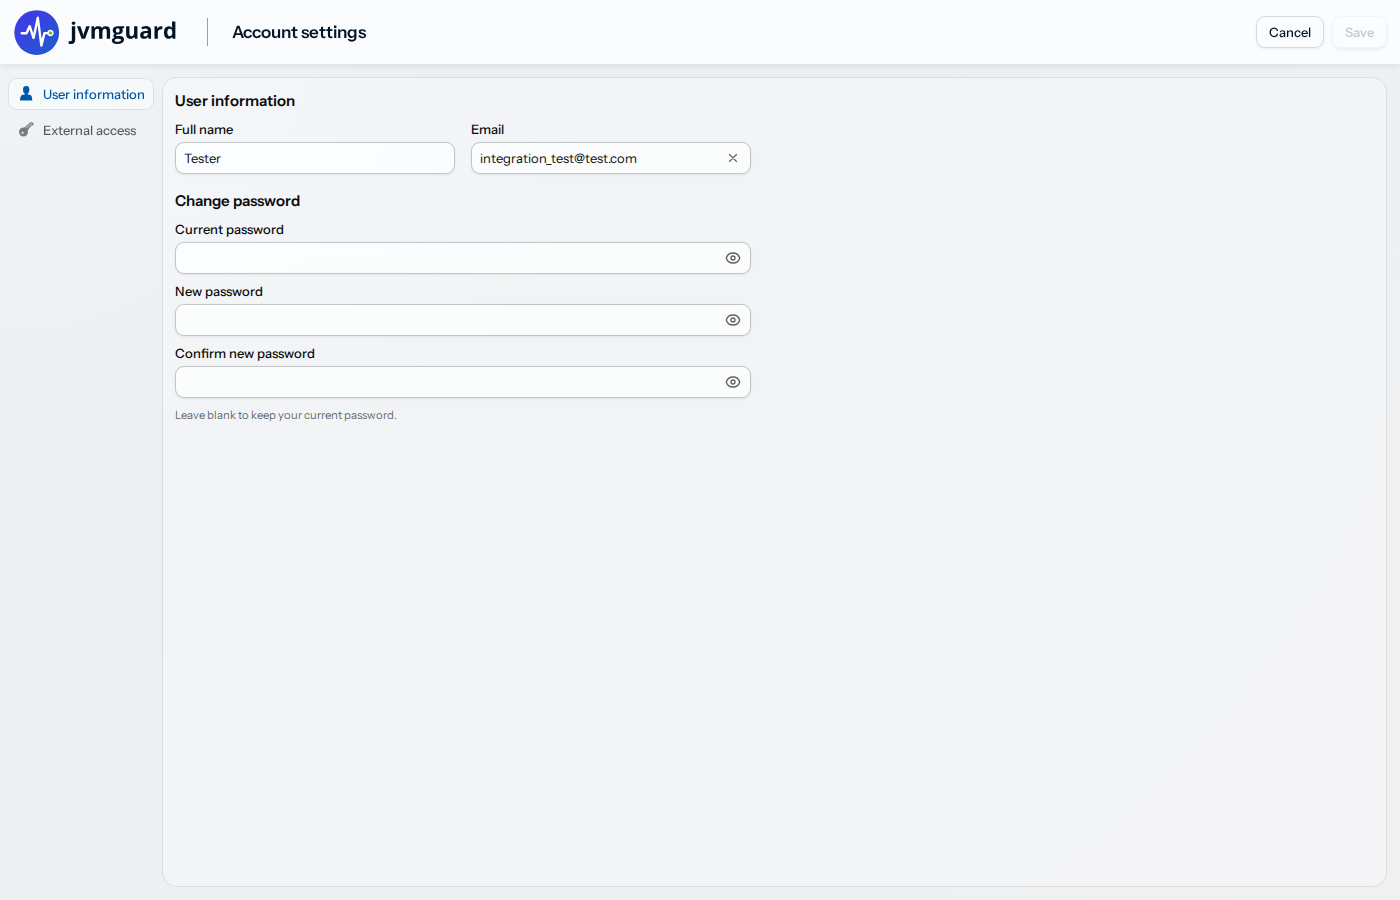
User settings, like your name and password can be adjusted by following the “Account Settings” link. When two-factor authentication is enabled on the server, you also set up or reconfigure your authenticator on the same “User information” page. If your access level is “profiler”, this is where you can see the VM groups that you are allowed to modify.
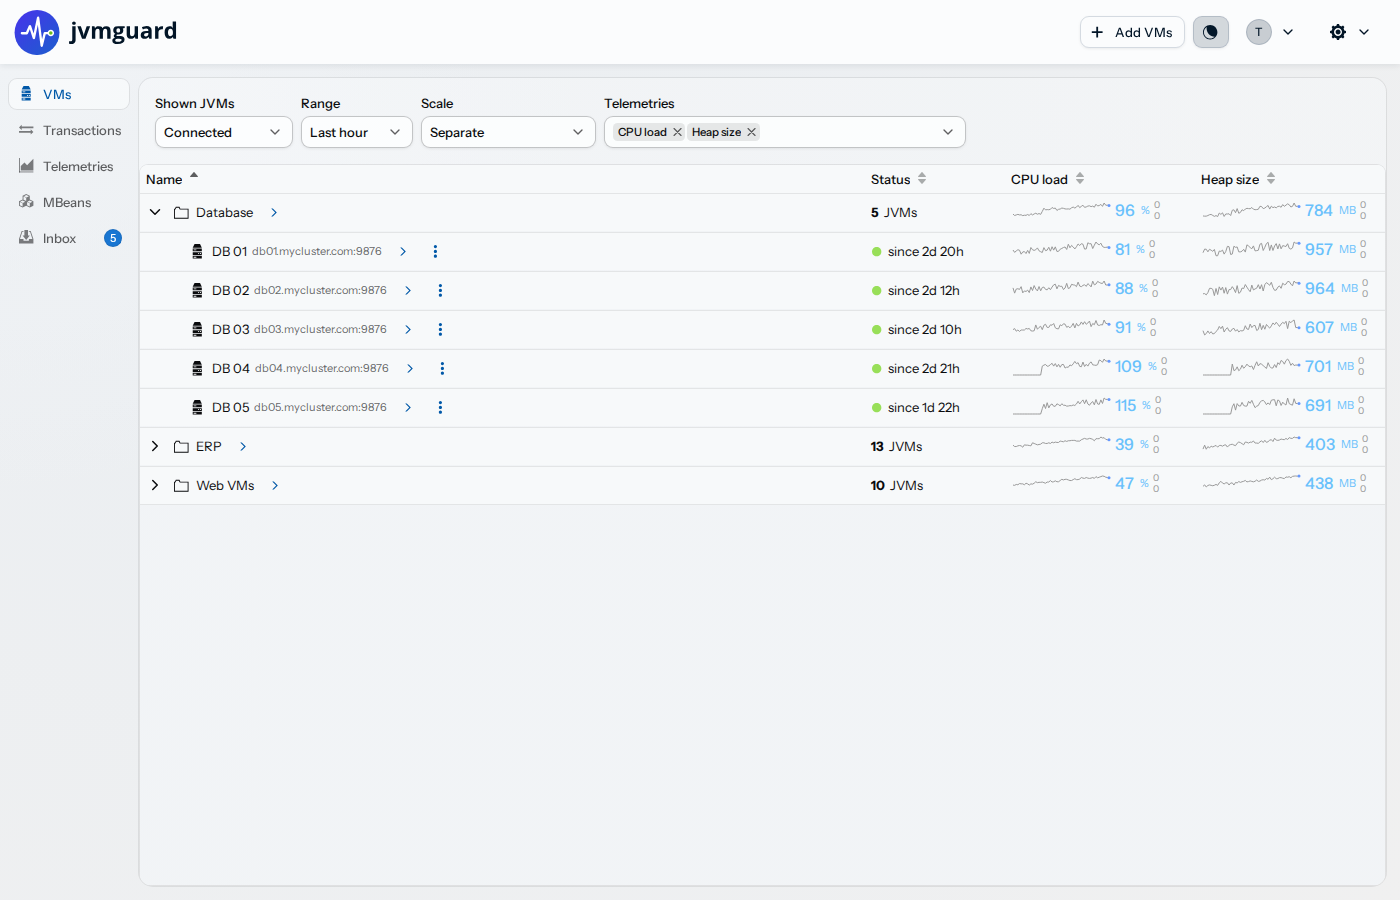
Dark or Light mode
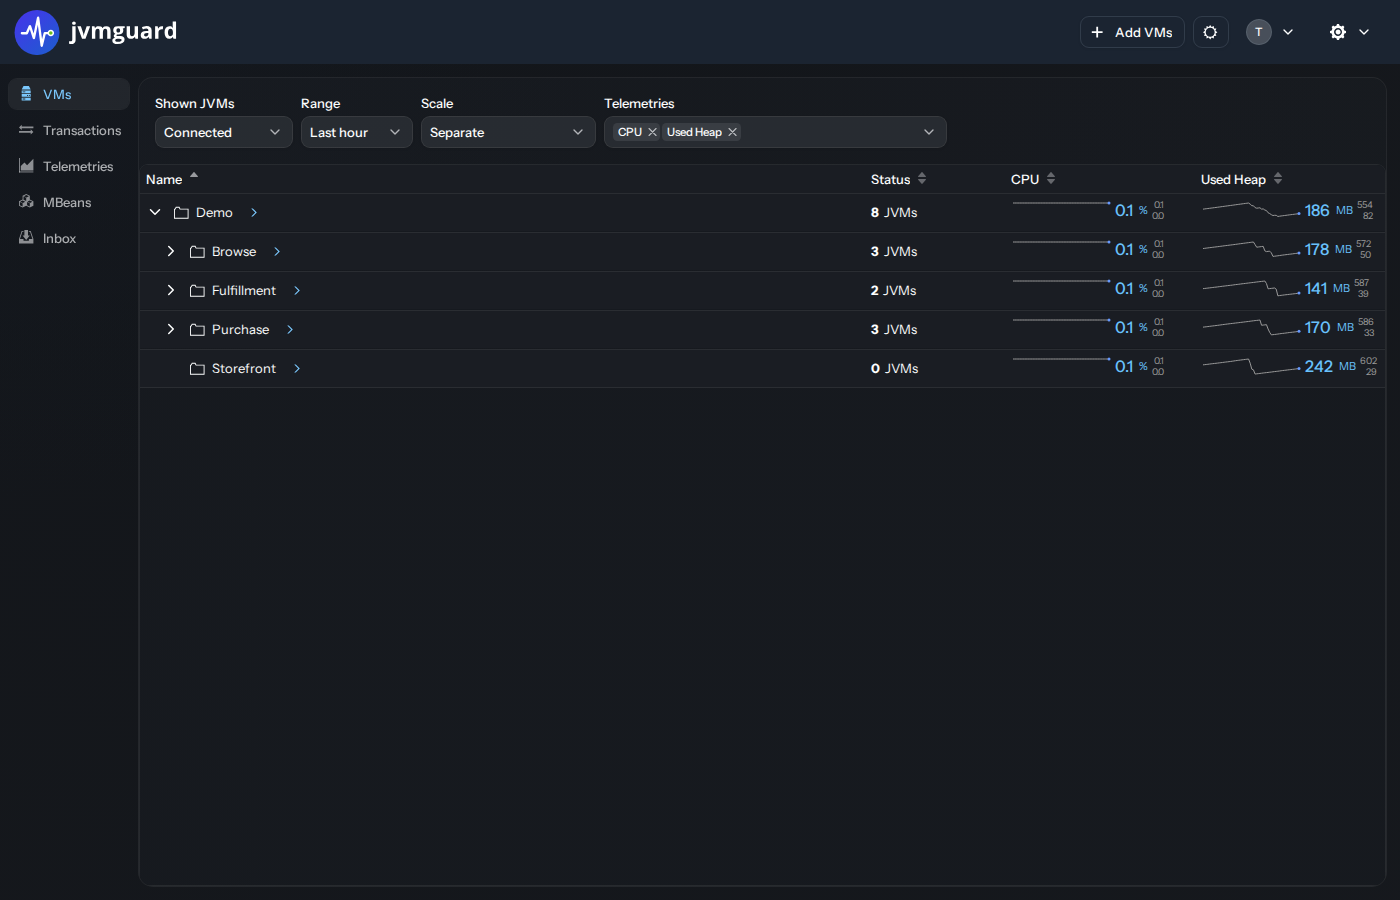
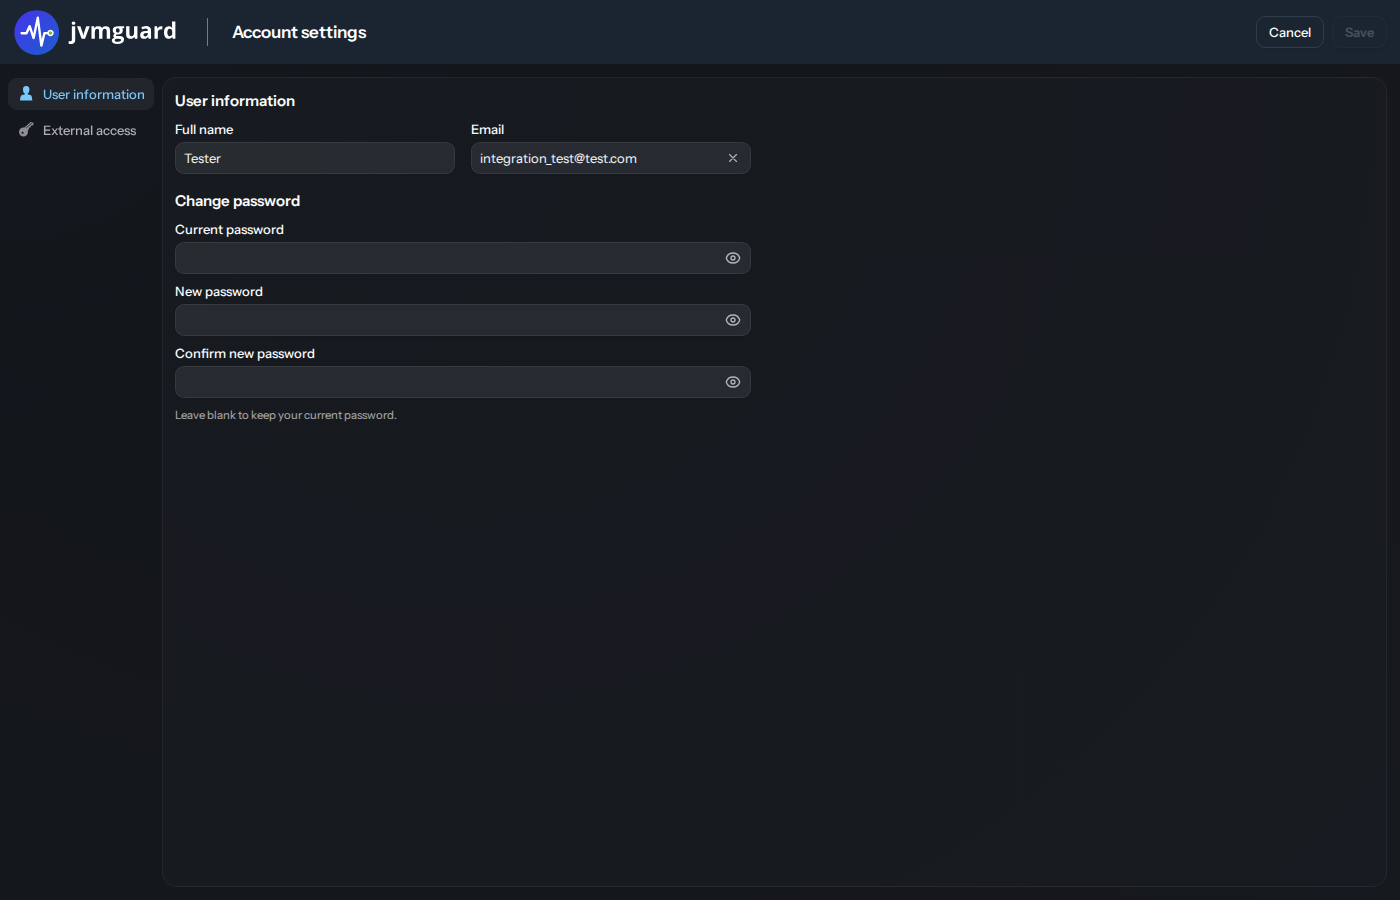
Section titled “Dark or Light mode”By default, jvmguard performs the theme selection according to your system preferences. If you prefer a different theme, use the theme switcher in the header. The setting is persistent for the current browser.