Profiling in production
There are several reasons why you should not have a profiler running in production at all times. For one, there is the overhead that may be unacceptably high depending on the profiling settings. Profilers are geared towards maximizing the extraction of useful information with no explicit guarantees as to the incurred overhead. Also, the use of the native profiling interface in the JVM (JVMTI) is something that is an additional risk in a production environment. Depending on whether you use non-standard garbage collectors or other JVM tuning options, there may be stability concerns, since the JVM is not tested as extensively with JVMTI as it is without.
However, the best defense against performance problems is defense in depth. Sometimes there are situations that require more information than what can be obtained from the low overhead monitoring and sampling techniques that are available in APM tools and continuous profilers.
Recording JProfiler snapshots
Section titled “Recording JProfiler snapshots”For these cases, jvmguard can load the JProfiler profiling agent into a monitored JVM on demand. JProfiler’s native JVMTI library is optimized for in-production use and jvmguard configures it to record in sampling mode, so the overhead stays low. Especially for Java 17+, the overhead of JVMTI sampling is comparable to async sampling. The result of this operation is a JProfiler snapshot file that can be downloaded from jvmguard and opened in JProfiler.
You do not need to install or copy anything yourself. The first time you record a JProfiler snapshot for a given platform, jvmguard downloads the matching JProfiler agent package for the monitored VM’s operating system and architecture, caches it, and transfers it to the agent. Subsequent recordings will reuse the cached package. This requires the jvmguard server to be able to reach the JProfiler website.
Once the profiling agent has been loaded, its JVMTI cannot be turned off again. As long as the JVM is running, it will remain in this state. Typically, the overhead of the loaded agent without any data recording is less than 1%, though.
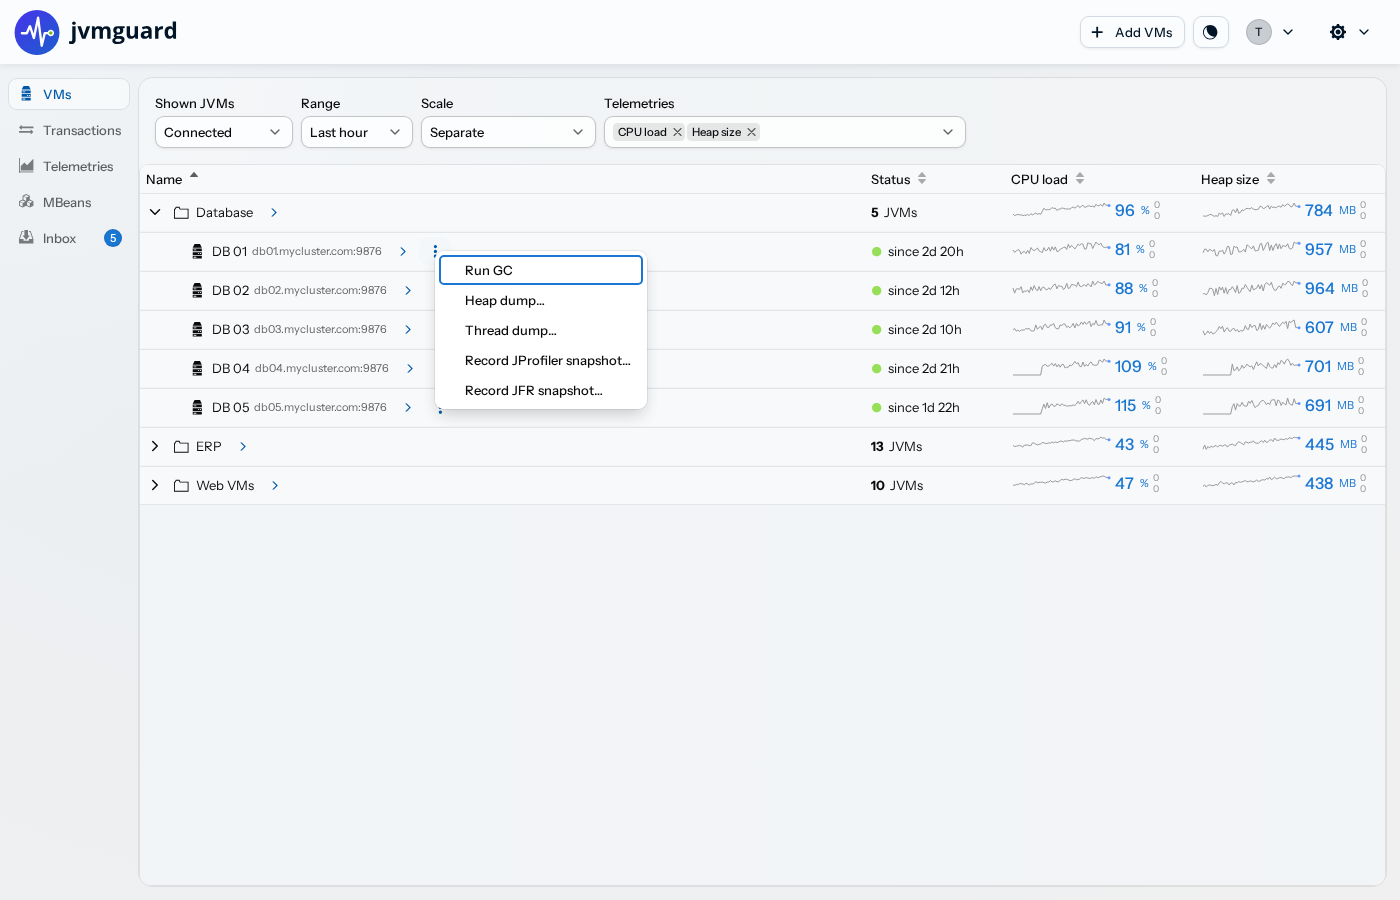
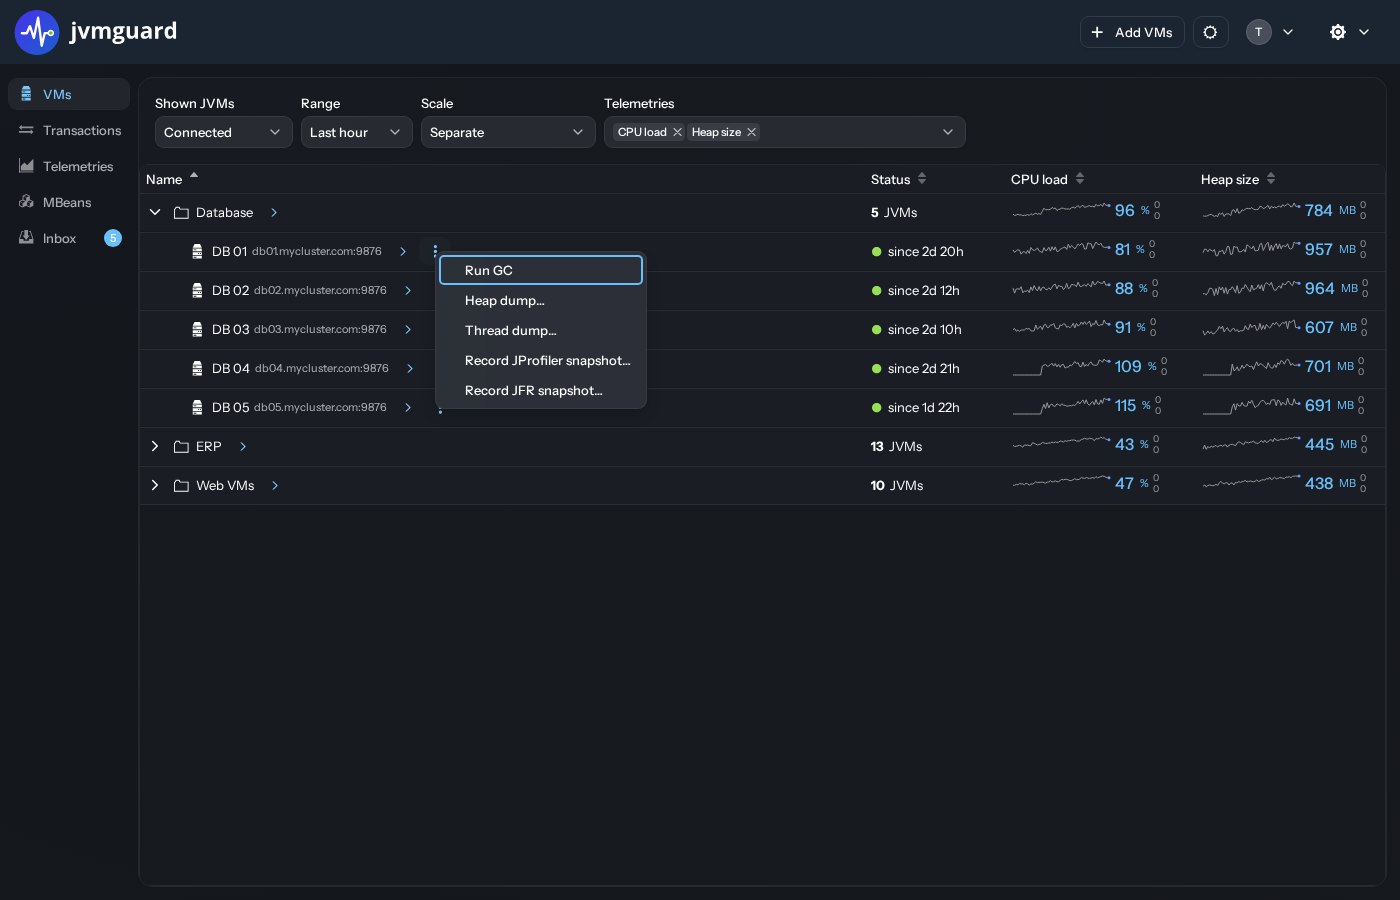
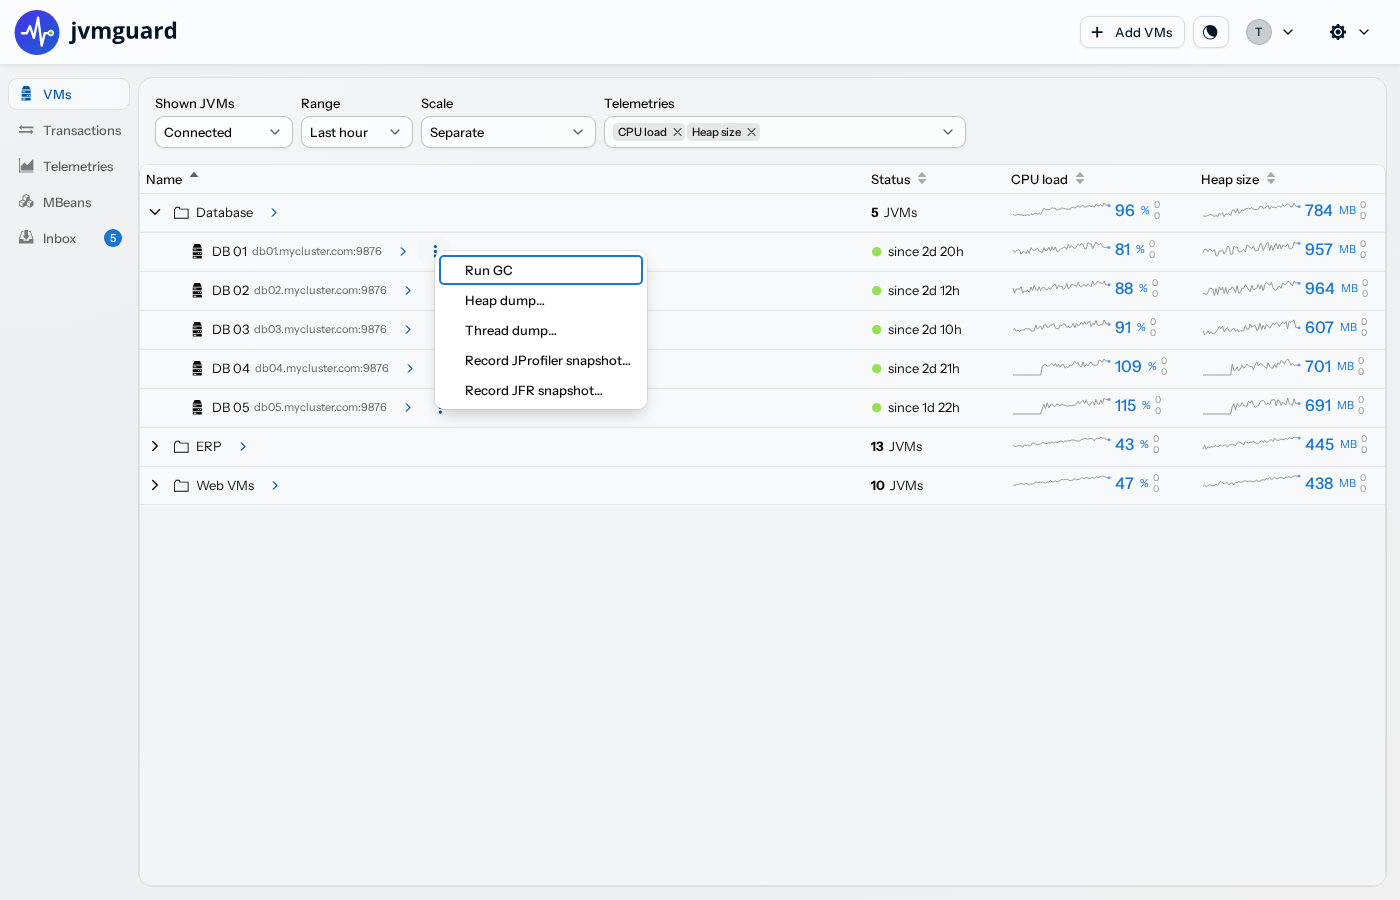
To take a JProfiler snapshot of a particular VM, go to the VMs view, click on the “actions” link next to the VM and select “Record JProfiler snapshot”.
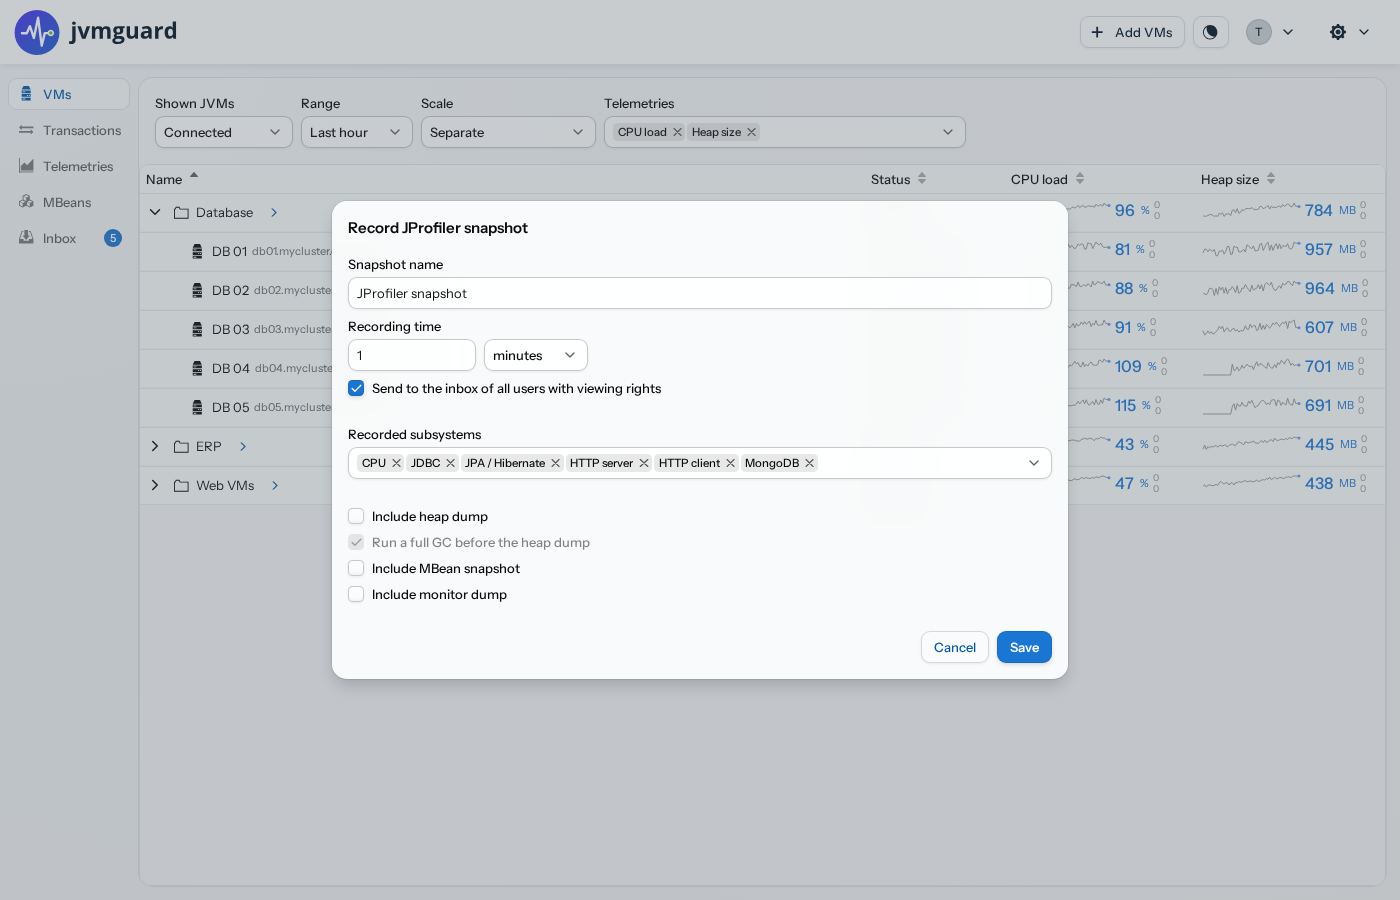
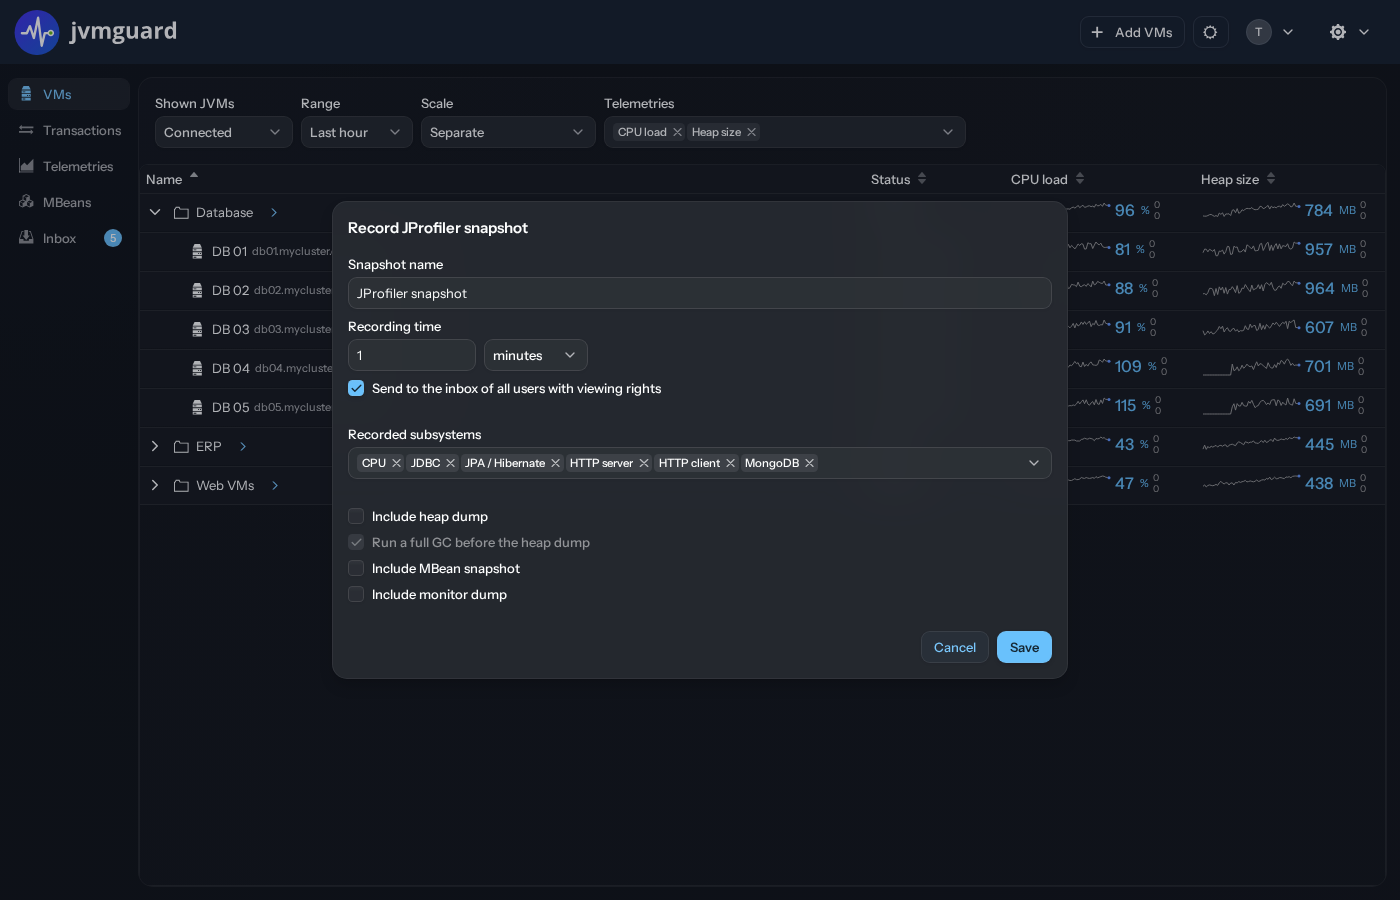
You can configure the duration of the recording and select which subsystems are recorded: CPU, allocations and monitor blocking, as well as the JProfiler probes for JDBC, JPA, HTTP, MongoDB and many others. jvmguard monitoring is not impacted by the recording. In addition, you can capture additional data at the end of the recording window and store it in the same snapshot: a heap dump (optionally preceded by a full garbage collection), an MBean snapshot and a monitor dump.
To take snapshots automatically if the CPU load is too high, you can set up a threshold for the CPU telemetry and configure a trigger that includes the “Record JProfiler snapshot” trigger action.
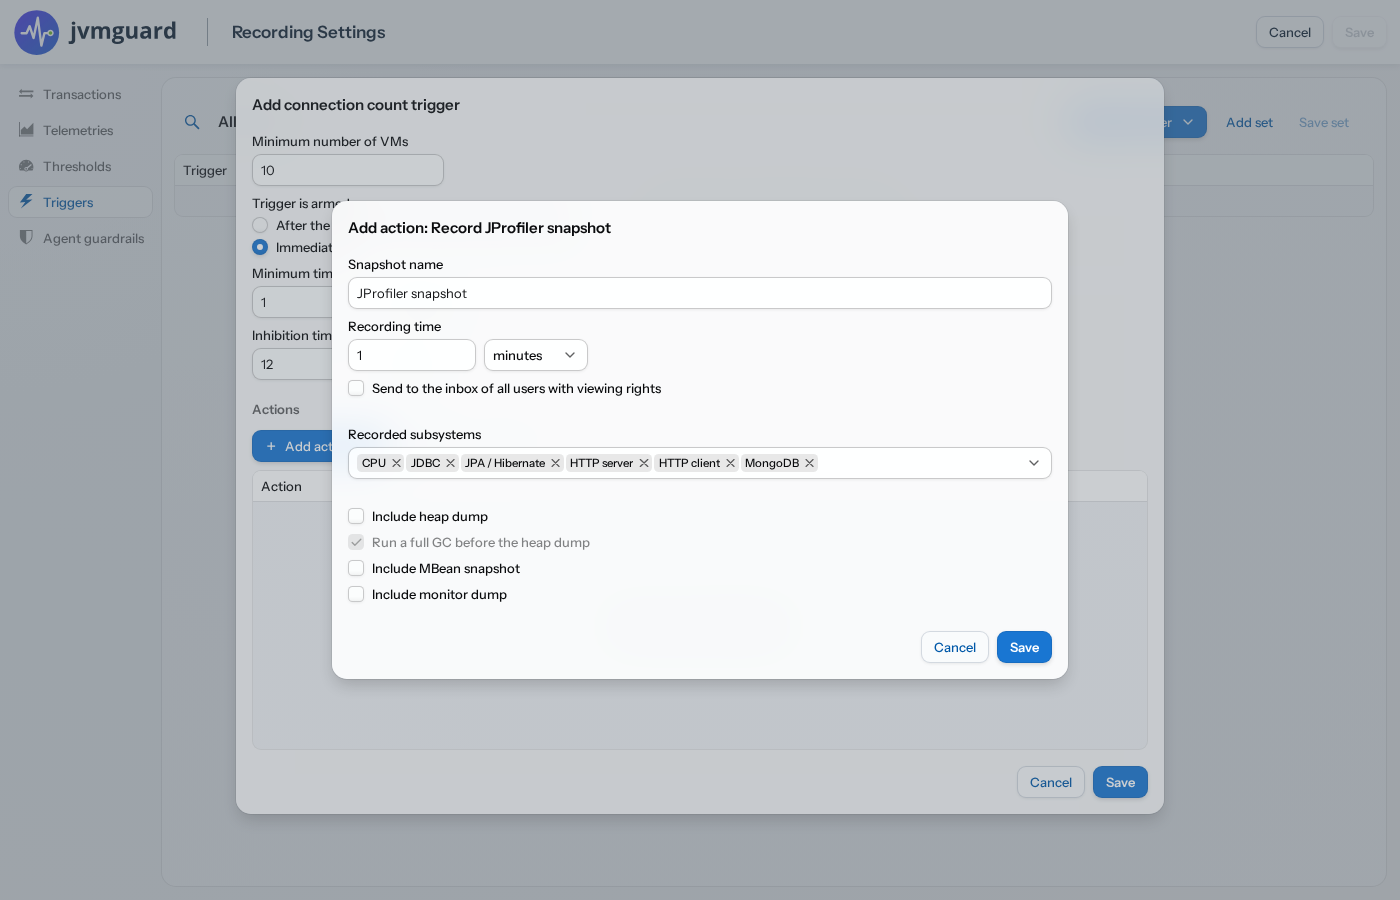
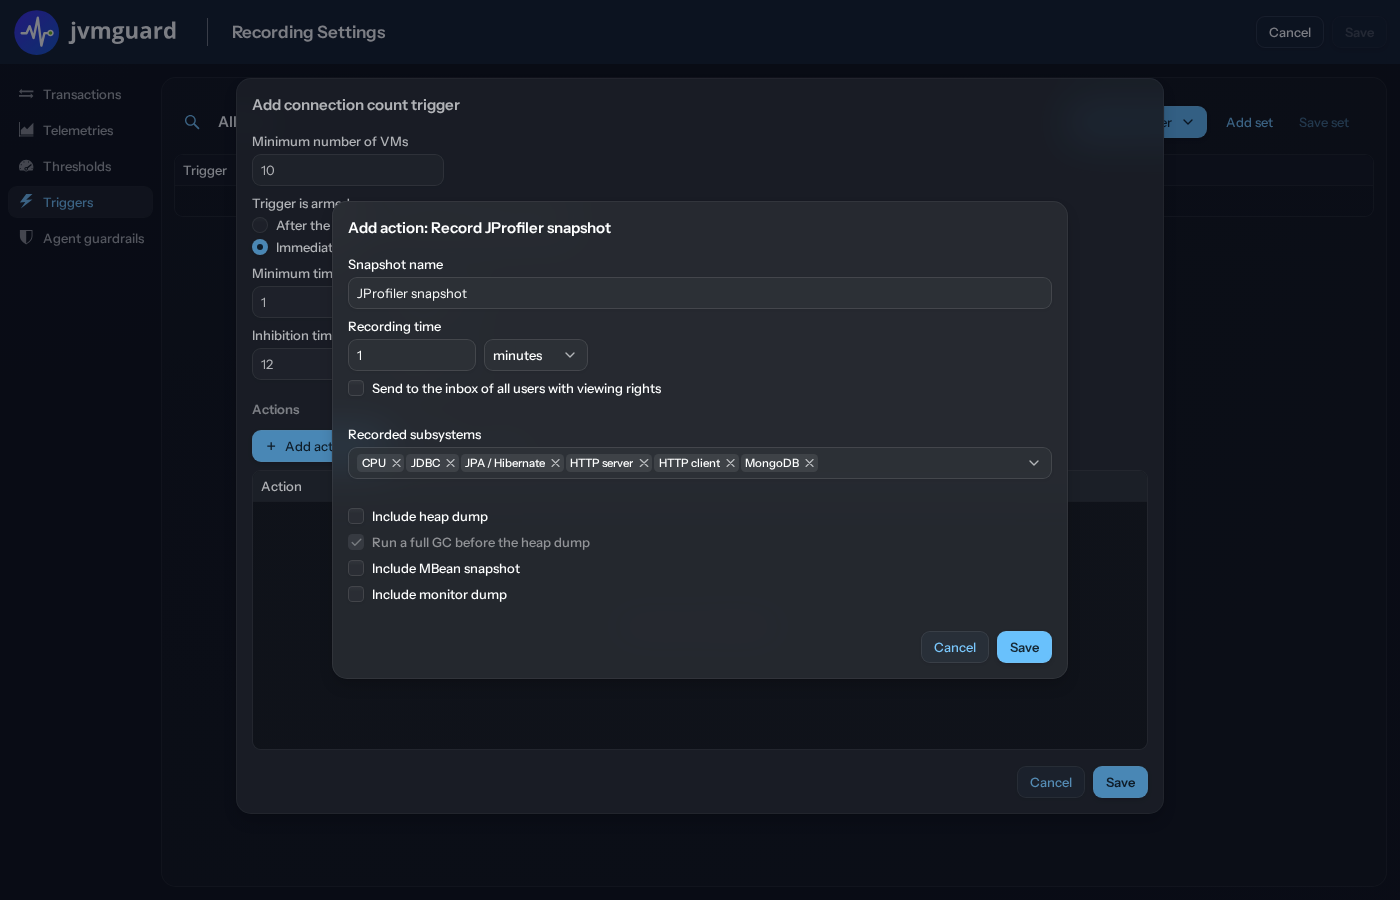
Note that only the last offending VM will be profiled, not all of them.
Viewing JProfiler snapshots in JProfiler
Section titled “Viewing JProfiler snapshots in JProfiler”JProfiler snapshots are delivered to your jvmguard inbox from where you can download them. The file extension is “.jps” which stands for “JProfiler snapshot”. If you have JProfiler installed, you can double-click on the snapshot file to open it, or choose Session ▸ Open Snapshot from JProfiler’s main menu.
Recording JFR snapshots
Section titled “Recording JFR snapshots”An alternative mechanism to get more low-level information on a monitored VM is to record a JDK Flight Recorder
(JFR) snapshot. The Java version of the monitored VM has to be 11+,
and the JRE has to include the module jdk.jfr. JFR recording can have very low overhead, and it does not load
the JVMTI.
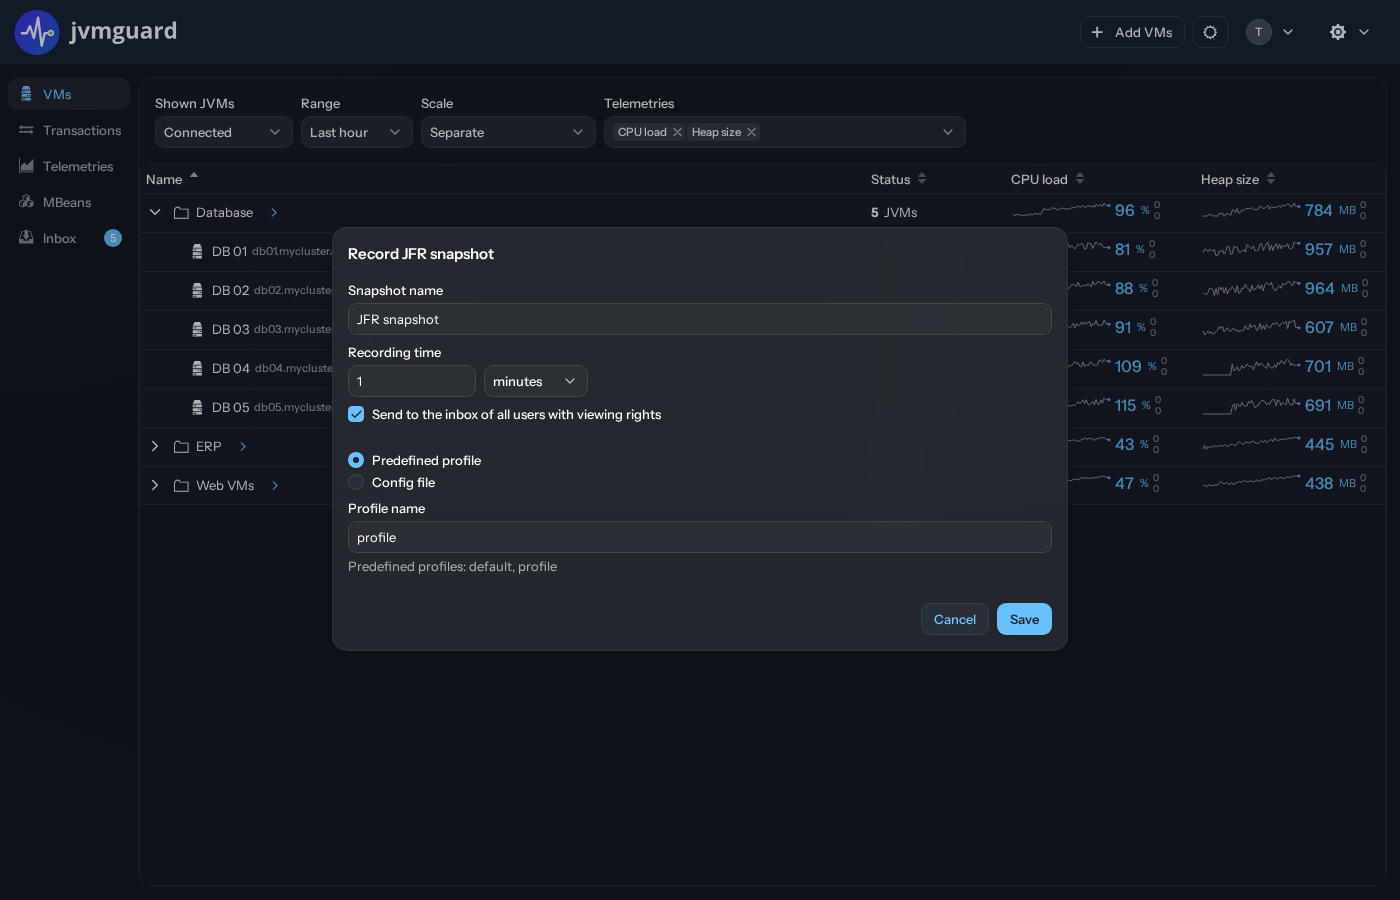
To record a JFR snapshot, go to the VMs view, click on the “actions” link next to the VM and select “Record JDK Flight Recorder snapshot”.
Besides configuring the duration of the JFR recording, you can choose a predefined setting or upload the contents of
a .jfc settings file that was exported from the “Flight recording template manager” in JMC.
The two predefined settings that are guaranteed to exist are “default” and “profile”. jvmguard suggests to use “profile”
by default, because it records more relevant information. Other settings can be predefined by placing .jfc files in
the lib/jfr directory of the JVM that is monitored. If you upload a settings file, make sure that is created for a
compatible Java version.
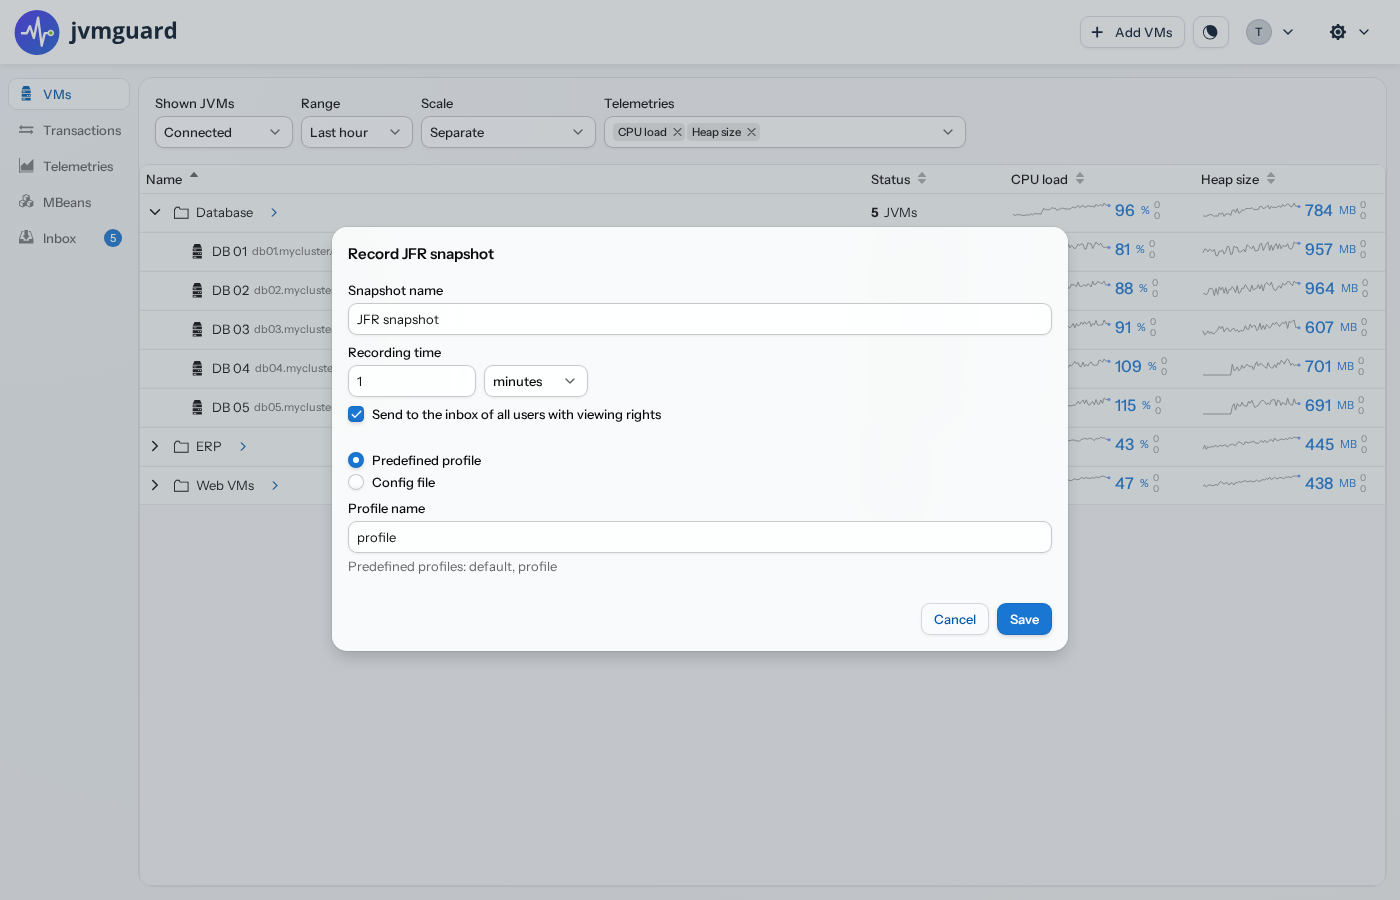
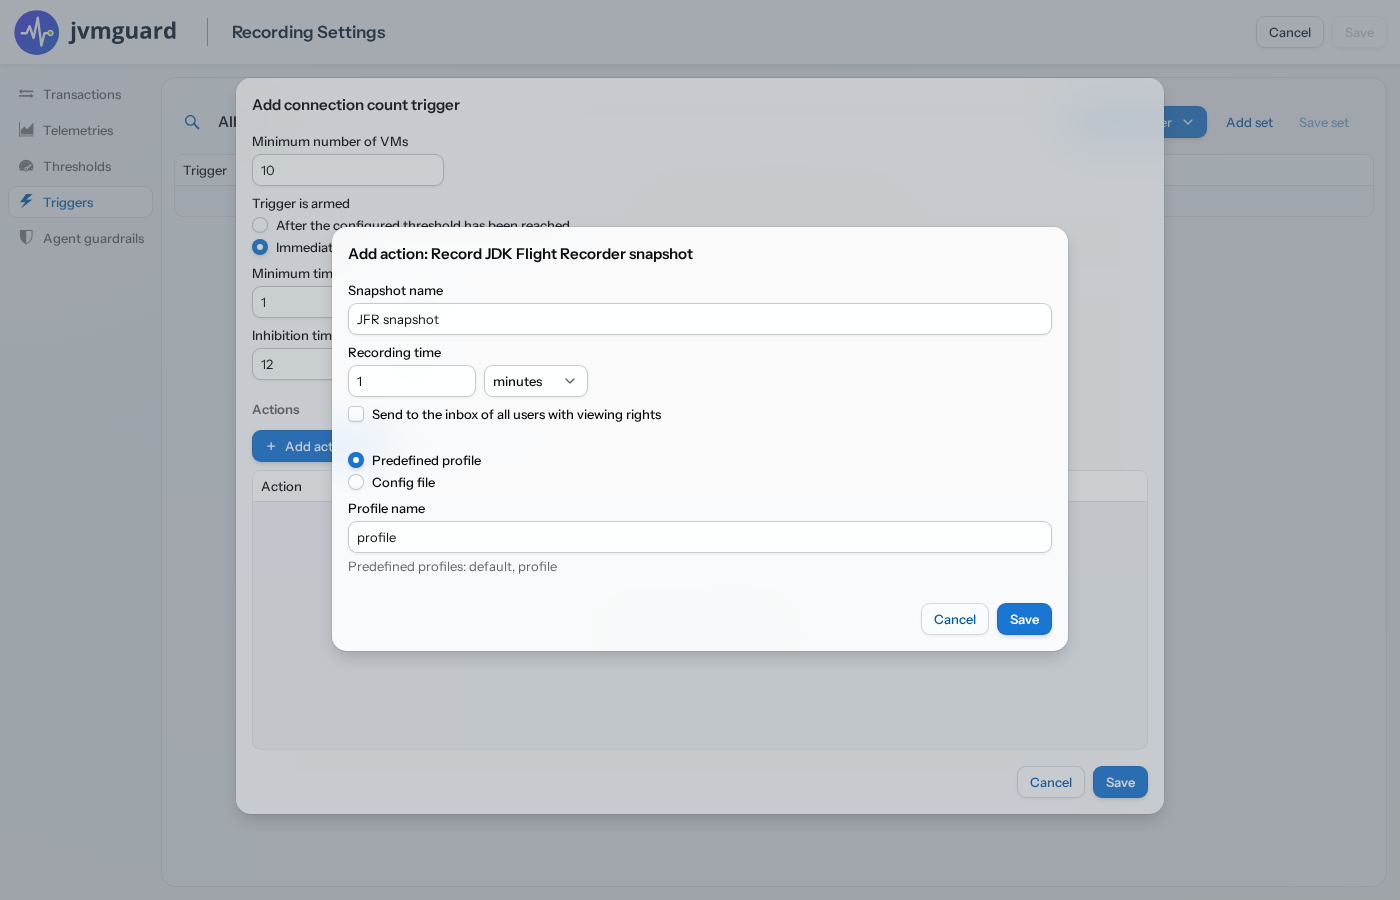
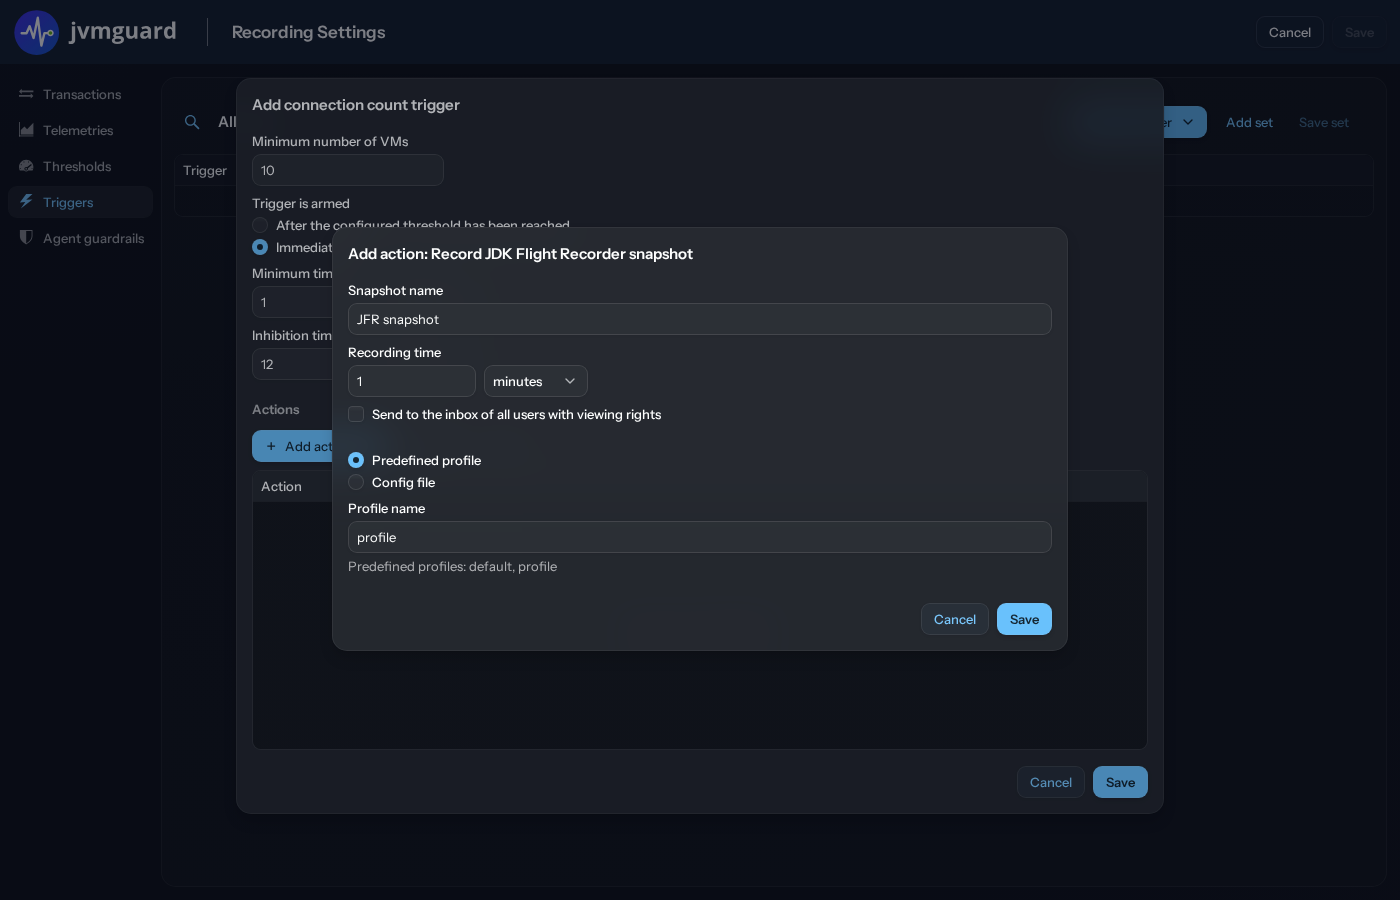
As with the other recordings above, JFR snapshots can also be recorded automatically with triggers and the corresponding trigger action for JFR recording.
While you can use JMC to view JFR snapshots, we recommend using JProfiler, just like for JProfiler snapshots. In addition to CPU, allocation, and monitor recordings, JProfiler shows a number of probes that are constructed from JFR events.

